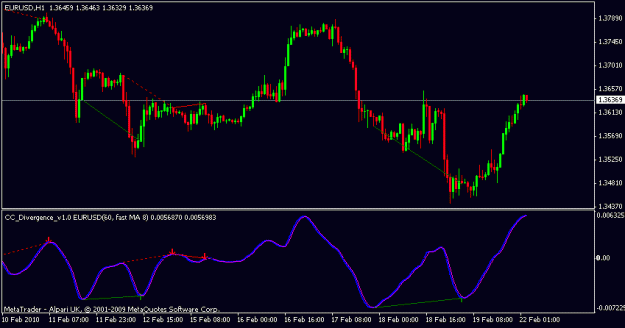
I just want to add a few cents to the discussion. I remember seeing some video regarding divergence. On top of divergence itself, some rules were followed to make sure entries were not false signals. I am leaving a picture that says it all. The trader was using another indicator, but MACD is often mentioned to be the best for divergence trading. I hope I am not interfering with the spirit of this thread.
|
Joined Jun 2008
|
Status: Divergence Seeker
|1,749 Posts
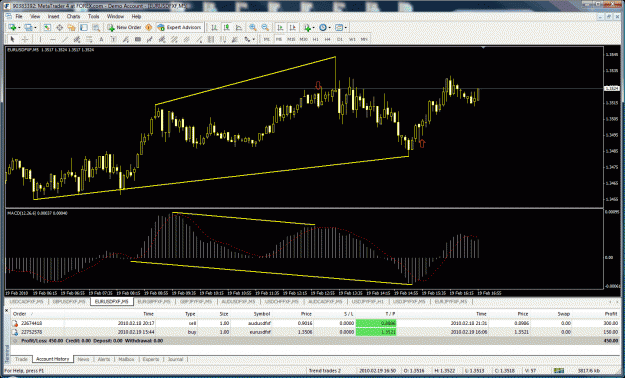
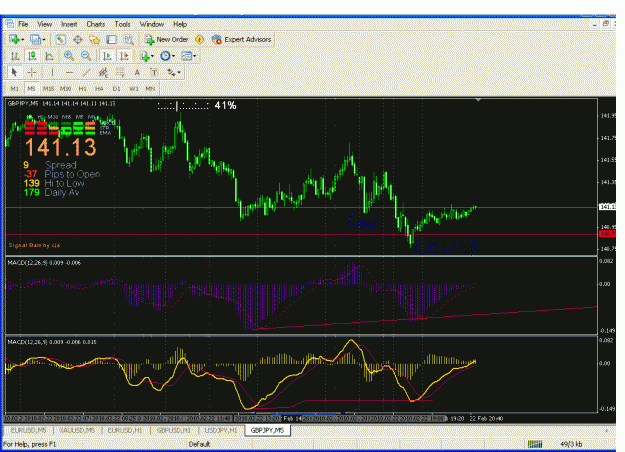
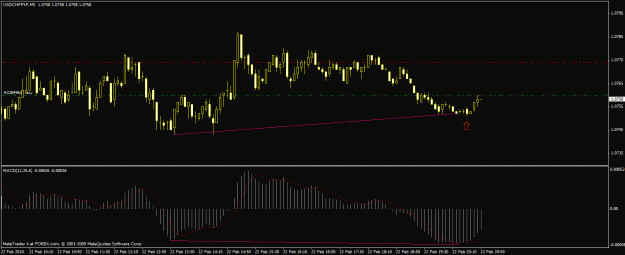
I Like to share little bit advanced level on this system by using H 1 Chart and trying to predicate who is going to dominate the market and what you should do In the m5 chart
I am attaching the H 1 CHART where you can see as the day progress the MACD bars deepness is reducing which says that the selling pressure is
reducing. The red line in the MACD cross was still bullish during Asia session and by the time new york market started the price Went up
So based on this you can enter for a long trade using M 5 when there is a
price drop
I understand what your both saying here will the extra analysis give you a better equity curve..will you miss out on some good signals because parts of the puzzle dont fit ?
hats the only thing I really worry about in trading too much information perhaps can cloud the essentials ie'is this a good signal'
Ive always worked on the principle of taking every signal im in front of the screen for I take no notice of support res levels or pivot points... trend lines yes but with divergence I dont use them because im mixing a subjective matter with a none subjective matter ie where to draw the trend line and clear diversity with the macd.
Over many years I have come to the conclusion that to disregard a trade because of support or resistance in the LONG run doesnt matter its swing and round abouts.
Most of my charts system utilize simplistic approach in the case of trend systems identify the trend by using a mechanical method that will be the same for every trade and is not subjective and then identify the entry.
With this style of trading and I thank you hargrip for getting me interested in diversity again I still like to keep it mechanical.And for me I utilze just 2 rules atm
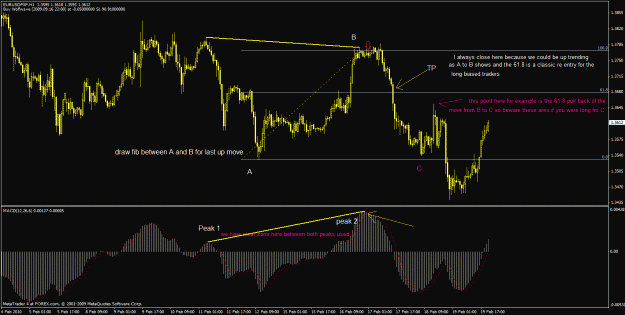
For a long I use diversity between 2 peaks above the zero line but the 2 peaks must be broken by a peak below the zero line this way Im using a more defined pull back on price and not just waves of the macd above the zero line
Once the peak has diversity with price I wait for the entry which is the main line cutting up through the signal line
This keeps things simple and none subjective my TP is always the the golden fib ratio 61.8 and in the case of a long will be the 61.8 level of the last down move.
lets keep this going and please harigp please dont take my comments as a move to change any thing here
|
Joined Jun 2008
|
Status: Divergence Seeker
|1,749 Posts
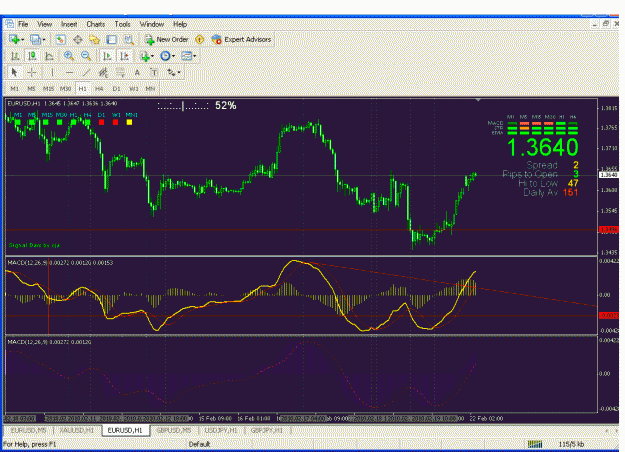
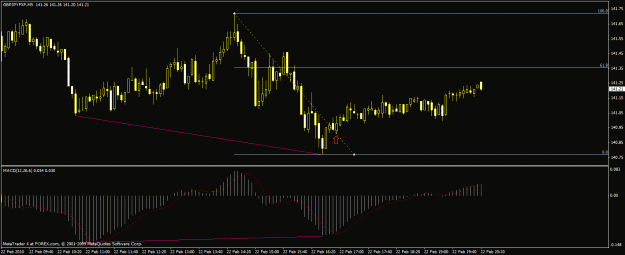
The EU in one hour chart the MACD is playing above the zero line. If the bullishness continues the MACD cross will be above the zero line with some retrace but not crossing the zero line down
If this is going to be the H1 outlook on EU, buy the dip using M5 chart.
A good question and one that cropps up in all threads
ideally we want to trade with volatility and that really means with the US market open...
Saying that if I'm in front of the PC and see a signal with the US closed I will often take it..
If you've made 3 trades that day and you have made some good money a trade in low volatility is worth the risk...if you've had a bad trading day Id prob leave it alone and wait for a better opportunity
|
Joined Jun 2008
|
Status: Divergence Seeker
|1,749 Posts
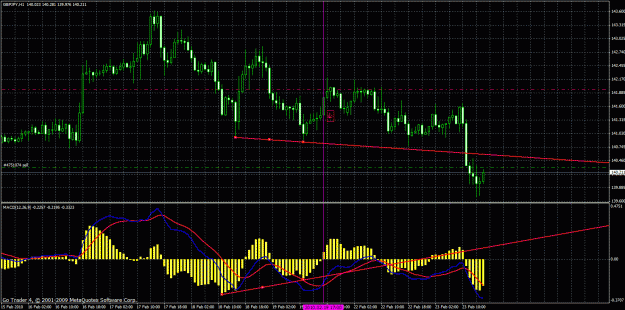
[quote=harigp;3485281]The EU in one hour chart the MACD is playing above the zero line. If the bullishness continues the MACD cross will be above the zero line with some retrace but not crossing the zero line down
If this is going to be the H1 outlook on EU, buy the dip using M5 chart.
Could you explain how in the G/J 1H chart what I am missing? There was a divergence (triple peaks even) and I've marked it where I think you should go long based on your rules.