• Home
  • Forums
  • Trades
  • News
  • Calendar
  • Market
  • Brokers
  • Login
  • Join
  • User/Email: Password:
  • 12:18am
Menu
  • Forums
  • Trades
  • News
  • Calendar
  • Market
  • Brokers
  • Login
  • Join
  • 12:18am
Sister Sites
  • Metals Mine
  • Energy EXCH
  • Crypto Craft

Options

Bookmark Thread

First Page First Unread Last Page Last Post

Print Thread

Similar Threads

Pipware MiniCharts - looking for similar indicator 0 replies

Pipware minichart alternative? 0 replies

  • Commercial Content
  • /
  • Reply to Thread
  • Subscribe
  • 985
Attachments: pipware.com
Exit Attachments

pipware.com

  • Last Post
  •  
  • 1 2526Page 272829 153
  • 1 Page 27 153
  •  
  • Post #521
  • Quote
  • Jan 19, 2010 3:09pm Jan 19, 2010 3:09pm
  •  stratman
  • | Commercial Member | Joined Jul 2009 | 1,436 Posts
After doing the lesson on the fractal breakout strategy:

Fractal Breakouts

Lesson 06 | Fractal Breakout Strategy

I was asked if the Fractal Support and Resistance ability is only available by using the dashboard. Quick answer is Yes and No

I haven't written a free indicator for this but you can use other indicators that are freely available. One is attached to this post '#KG Support and Resistance.mq4'.

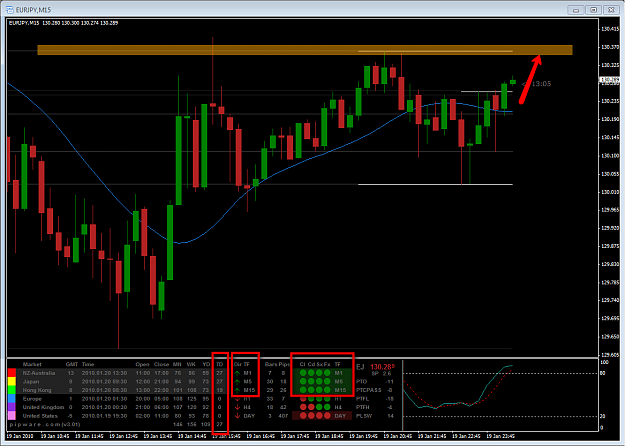
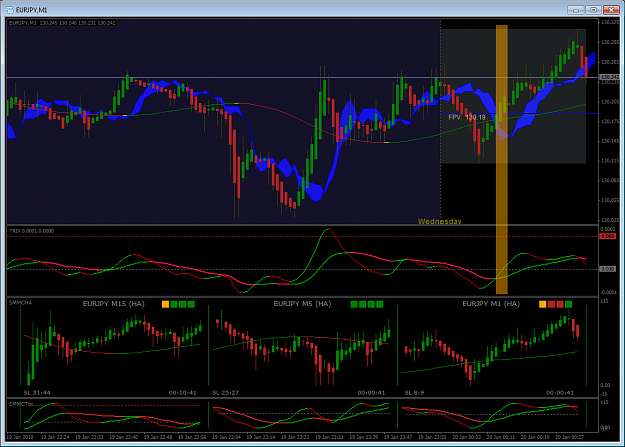
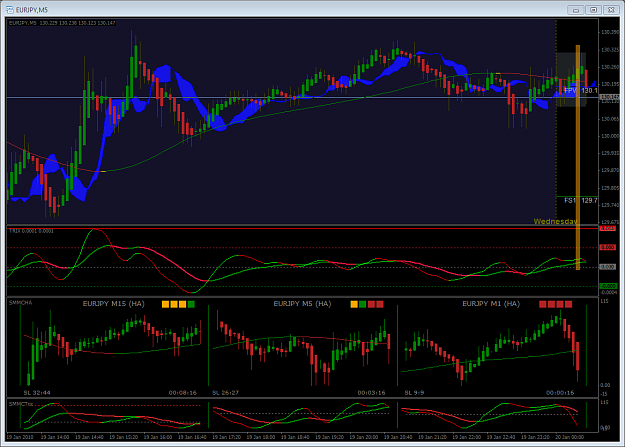
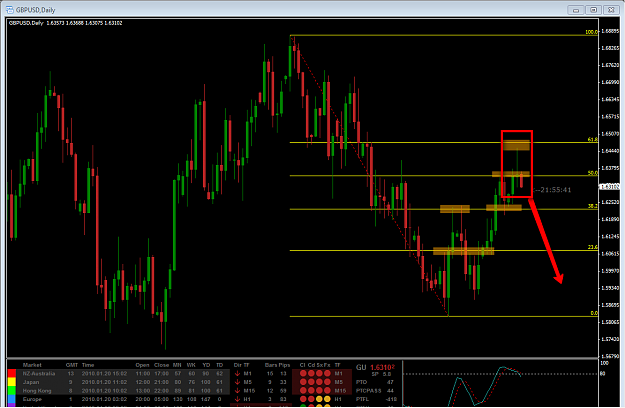
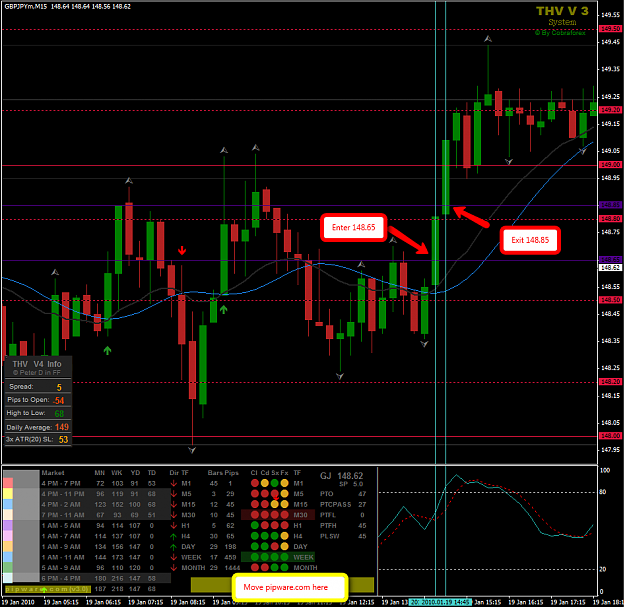
Here's a shot of the dashboard functionality. I turned on the fractals (circles), multi-timeframe support and resistance lines, and arrows (alerts are on as well).

Attached Image (click to enlarge)
Click to Enlarge

Name: FractalSRDB.png
Size: 35 KB


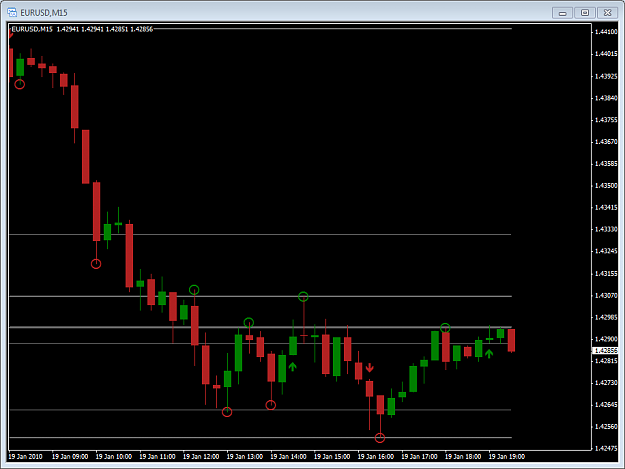
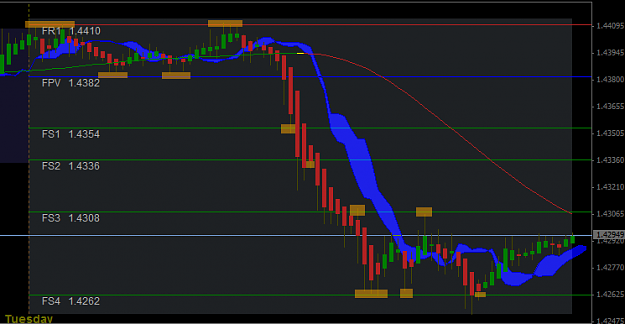
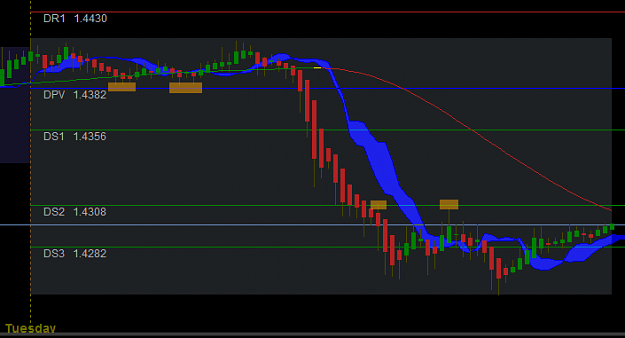
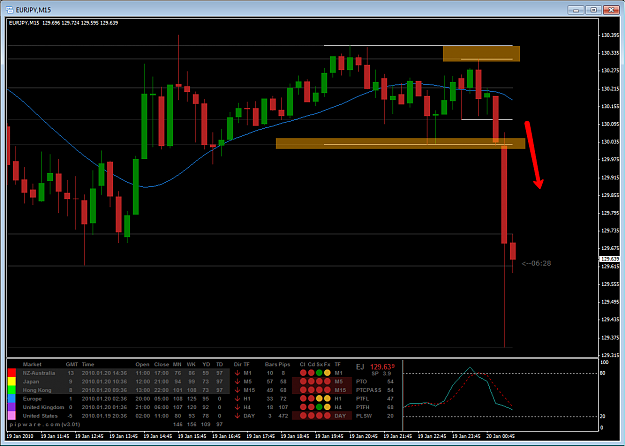
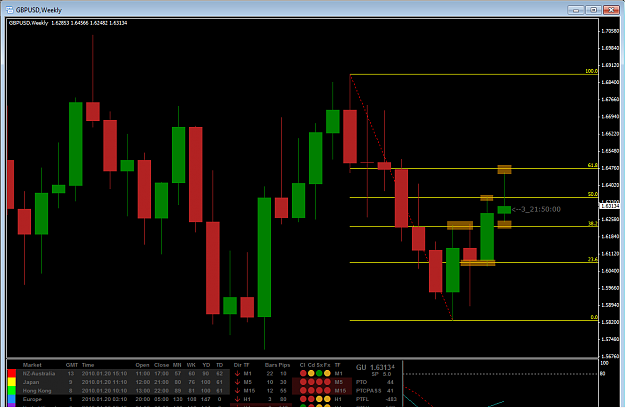
And here's a shot with the Bill Williams Fractal indicator and the '#KG Support and Resistance.mq4' multi-timeframe fractal SR indicator. The Bill Williams Fractal indicator is already part of MT4.

Attached Image (click to enlarge)
Click to Enlarge

Name: FractalSRKG.png
Size: 34 KB


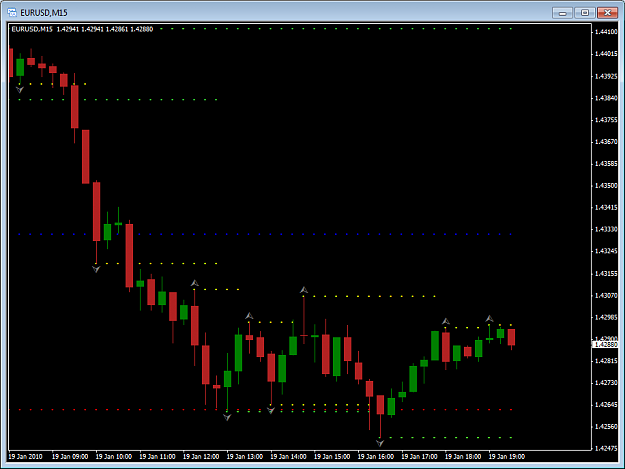
The KG version appears cluttered as it displays every fractal SR as a line ie multiple lines per timeframe. The dashboard version displays two lines per timeframe (from the most recent upper/lower fractal) for each enabled timeframe. The dashboard also displays breakout arrows and gives you alerts when a break occurs.

If you want the added functionality, please consider purchasing the dashboard ... it takes me a lot of effort to program indicators
Attached File
File Type: mq4 #KG Support and Resistance.mq4   5 KB | 690 downloads
 
 
  • Post #522
  • Quote
  • Jan 19, 2010 3:42pm Jan 19, 2010 3:42pm
  •  stratman
  • | Commercial Member | Joined Jul 2009 | 1,436 Posts
A few posts back I posted a video lesson on pivots

Lesson 03 | Pivot Points - Daily & Fibonacci

If you watched that video, you will know that there are lot's of choices for pivot calculations eg Normal, Fibonacci, Woodies, Caramilla etc

Which should you use? For THV on EURUSD I follow Cobra's recommendation to use Fibonacci pivot values. I'll show you by way of example using todays price action.

This is the Fib pivots. The points where the pivots were respected are highlighted.

Attached Image (click to enlarge)
Click to Enlarge

Name: Fib_Pivots.png
Size: 26 KB


Here's the normal daily pivots

Attached Image (click to enlarge)
Click to Enlarge

Name: Pivots.png
Size: 19 KB


Which would you use

NOTE
: As a commercial member of Forex Factory I can only post to my own thread ie even though I am a member of the THV team, I can't post to the THV thread . As this post has no commercial content, can someone please post it to the THV thread (including this note).

cheers
stratman
 
 
  • Post #523
  • Quote
  • Edited at 7:54pm Jan 19, 2010 7:27pm | Edited at 7:54pm
  •  stratman
  • | Commercial Member | Joined Jul 2009 | 1,436 Posts
In the meantime, you may want to turn a few columns on/off to get the dash a bit smaller. Here's an example:

Attached Image


EDIT: The dashboard rows and columns have a lot of flexibility ie you choose what you want displayed. For example, you can change the names of the countries eg NZ, JP, HK etc and adjust the width of that column. You can also change the text in all the heading labels. You many want to have less THV or Fractal rows ... or market hours rows. It's all in the manual


Quoting Nobitacu
Disliked
Hello Stratman,

I've been wondering... Is there anyway to make the dashboard so that it can be displayed vertically? That way I'll actually be able to fit this onto my chart (as you've seen my setup, I split my screen with 2 charts, if displayed horizontally, the dashboard does not fit...), where then I'll be able to attach it to the left side of my main window. But I guess that might be hard since the market hours and data are displayed/lined up horizontally... Hmmm... Still, i wonder if this would somehow to possible. haha, I suppose once the...
Ignored
 
 
  • Post #524
  • Quote
  • Jan 19, 2010 7:43pm Jan 19, 2010 7:43pm
  •  FormulaOneFa
  • | Joined Sep 2009 | Status: Member | 45 Posts
I personally think divergence is important for any level of traders and wonder whether you could post a youtube video about applying divergence using THV when you get a chance. It helped me a lot and could help novice traders as well.

cheers
 
 
  • Post #525
  • Quote
  • Jan 19, 2010 7:48pm Jan 19, 2010 7:48pm
  •  stratman
  • | Commercial Member | Joined Jul 2009 | 1,436 Posts
I see many posts on the thv thread about how a thv setup occurred, the trade was entered then a loss was made. If your homework is done well there will be very few occassions where this occurs.

Take this EJ setup a few moments ago. All thv rules met on M5 and M1. We're moving away from the moving average and the daily pivot. But I had two reasons to stand aside:

1) Daily range for the day is still low (30 pips) ie less than my rule of 40 pips

2) Too close to the next resistance which is the top of the last H4 candle (the white line on my drawing) ... resistance shown highlighted.

The rules were met at the highlighted areas on the thv charts

Attached Image (click to enlarge)
Click to Enlarge

Name: EJ.png
Size: 72 KB


Attached Image (click to enlarge)
Click to Enlarge

Name: EJ-thvM1.png
Size: 68 KB


Attached Image (click to enlarge)
Click to Enlarge

Name: EJ-thvM5.png
Size: 69 KB
 
 
  • Post #526
  • Quote
  • Jan 19, 2010 7:49pm Jan 19, 2010 7:49pm
  •  stratman
  • | Commercial Member | Joined Jul 2009 | 1,436 Posts
That was going to be my next lesson

Quoting FormulaOneFa
Disliked
I personally think divergence is important for any level of traders and wonder whether you could post a youtube video about applying divergence using THV when you get a chance. It helped me a lot and could help novice traders as well.

cheers
Ignored
 
 
  • Post #527
  • Quote
  • Jan 19, 2010 8:35pm Jan 19, 2010 8:35pm
  •  live2trade_2
  • | Joined Dec 2009 | Status: Member | 26 Posts
Posted on THV for you.

I couldn't work out how to embed the images in the THV post. Is there a way?

John
..


Quoting stratman
Disliked
A few posts back I posted a video lesson on pivots

Lesson 03 | Pivot Points - Daily & Fibonacci

If you watched that video, you will know that there are lot's of choices for pivot calculations eg Normal, Fibonacci, Woodies, Caramilla etc

Which should you use?...
Ignored
 
 
  • Post #528
  • Quote
  • Jan 19, 2010 8:42pm Jan 19, 2010 8:42pm
  •  stratman
  • | Commercial Member | Joined Jul 2009 | 1,436 Posts
Quoting stratman
Disliked
I see many posts on the thv thread about how a thv setup occurred, the trade was entered then a loss was made. If your homework is done well there will be very few occassions where this occurs.
Ignored
If you had have gone long based on thv rules alone ... look what would have happened ... you'd be a very sad puppy .

The better trade setup was short on the break of the previous H4 low ... you would have got a fractal break alert and perfect thv setup to trade. (I didn't get in as I was talking to someone on skype at the time).

Attached Image (click to enlarge)
Click to Enlarge

Name: EJ.png
Size: 69 KB
 
 
  • Post #529
  • Quote
  • Jan 19, 2010 9:09pm Jan 19, 2010 9:09pm
  •  stratman
  • | Commercial Member | Joined Jul 2009 | 1,436 Posts
This is the kind of candle pattern we look for. There is a very high probability that this will go short from here ... particularly if there's a close below 38.2 fib

btw, see how price is respecting fib levels for support and resistance points?

Weekly and then daily shown ...

Attached Image (click to enlarge)
Click to Enlarge

Name: GUW.png
Size: 57 KB


Attached Image (click to enlarge)
Click to Enlarge

Name: GU.png
Size: 62 KB
 
 
  • Post #530
  • Quote
  • Jan 19, 2010 11:07pm Jan 19, 2010 11:07pm
  •  stratman
  • | Commercial Member | Joined Jul 2009 | 1,436 Posts
Here's my latest tuition video

Lesson 07 Divergence

EDIT: Because I record my videos in high quality, youtube can take an hour or so to process them. They often provide lower quality version within a few minutes ie if you strike lower quality on any of my videos, give youtube a bit of time to finish processing a higher quality version.

Here's a few snaps from THV to show what I talk about in the video:

Attached Image


Attached Image


Attached Image


Attached Image


NOTE
: As a commercial member of Forex Factory I can only post to my own thread ie even though I am a member of the THV team, I can't post to the THV thread http://cdn.forexfactory.com/images/s...yim/crying.gif. As this post has no commercial content, can someone please post it to the THV thread (including this note .. please ensure all images show 'inline' ie not as links).

cheers
stratman
 
 
  • Post #531
  • Quote
  • Jan 19, 2010 11:32pm Jan 19, 2010 11:32pm
  •  live2trade_2
  • | Joined Dec 2009 | Status: Member | 26 Posts
Stratman

I've tried to post your posts from here to THV with the images but they always come up with a link to the image.

I'm more than happy to relay your posts THV but I can't get the images to appear. Any ideas?


Johno
..


Quoting stratman
Disliked
Here's my latest tuition video

Lesson 07 Divergence

EDIT: Because I record my videos in high quality, youtube can take an hour or so to process them....
Ignored
 
 
  • Post #532
  • Quote
  • Jan 19, 2010 11:48pm Jan 19, 2010 11:48pm
  •  stratman
  • | Commercial Member | Joined Jul 2009 | 1,436 Posts
It may be your browser? ... I use firefox ... use my mouse to hightlight what I want ... copy (ctrl-c) and then paste into the new post (ctrl-v) ... all works fine.


Quoting live2trade_2
Disliked
Stratman

I've tried to post your posts from here to THV with the images but they always come up with a link to the image.

I'm more than happy to relay your posts THV but I can't get the images to appear. Any ideas?


Johno
..
Ignored
 
 
  • Post #533
  • Quote
  • Jan 20, 2010 12:09am Jan 20, 2010 12:09am
  •  txtaz
  • | Joined Jul 2008 | Status: Member | 119 Posts
Quoting stratman
Disliked
This is the kind of candle pattern we look for. There is a very high probability that this will go short from here ... particularly if there's a close below 38.2 fib

btw, see how price is respecting fib levels for support and resistance points?

Weekly and then daily shown ...

Attachment 395752

Attachment 395746
Ignored
Great analysis Stratman! I was talking about this pair with a friend of mine and he pointed out the same things. Although, he's talking about a long on the break of the 61.8 as well. He's a fib trader and seems to trade pullbacks and breakouts.
txtaz
 
 
  • Post #534
  • Quote
  • Jan 20, 2010 12:15am Jan 20, 2010 12:15am
  •  live2trade_2
  • | Joined Dec 2009 | Status: Member | 26 Posts
That was the first thing I tried but it puts the images as links. I've tried with FFox Safari and Chrome (all the same).

I'll work on it.

We'll get there.


Johno
..

Quoting stratman
Disliked
It may be your browser? ... I use firefox ... use my mouse to hightlight what I want ... copy (ctrl-c) and then paste into the new post (ctrl-v) ... all works fine.
Ignored
 
 
  • Post #535
  • Quote
  • Jan 20, 2010 12:22am Jan 20, 2010 12:22am
  •  live2trade_2
  • | Joined Dec 2009 | Status: Member | 26 Posts
Ahh. Finally worked it out.

The relay post should be same as original.

Johno
..

Quoting live2trade_2
Disliked
That was the first thing I tried but it puts the images as links. I've tried with FFox Safari and Chrome (all the same).

I'll work on it.

We'll get there.


Johno
..
Ignored
 
 
  • Post #536
  • Quote
  • Jan 20, 2010 12:28am Jan 20, 2010 12:28am
  •  deadlyc
  • | Joined Dec 2009 | Status: Member | 7 Posts
First, I would you like to say thank you Stratman for helping others, including me out on this journey. I have been learning about Forex for the last 6 months, but didn't really put all I learn to work until now. I did read through the THV thread and that is how I come across this thread. I did four demo trades so far on this system. I do have a Micro account, but I was trying out Oanda Demo account. The spreads are much better than the Micro account. Three winners and one loser.

The loser was a trade I did on GBPJPY on Monday, which is Martin Luther King Day. The setup seemed to be right, but the volume was low. I didn't think a US holiday would have that much effect on GBPJPY. I lost 13 pips. Better know now than later I guess.

Two winners are from EURUSD and EURJPY during that sharp drop at 1:00 GMT I believe. The setups seemed to be right, but I didn't expect it to drop so fast. I didn't see any new release, but correct me if I'm wrong. I got 37 pips and 25 pips respectively.

The last winner is a GBPJPY trade with 20 pips. The chart is below. If I remember correctly, all the THV rules and fractals were met. It then crossed up through a pivot/S&R point, so I entered. I exited because it was near a H4 resistance area at about 148.89. I did however break the whole number 149. Sorry if my explanation is not so clear. It's my first one and I will try to do the next one better.

<a href="http://content.screencast.com/users/deadlyc/folders/Default/media/02dc3287-5833-4496-a379-e91e66f9cb06/GBPJPY_M5.png"><img class="embeddedObject" src="http://content.screencast.com/users/.../GBPJPY_M5.png" width="816" height="936" border="0" /></a>


<a href="http://content.screencast.com/users/deadlyc/folders/Default/media/1ce654e4-fe17-47e4-ab2b-4ac8a3087a55/GPYJPY_M15.png"><img class="embeddedObject" src="http://content.screencast.com/users/...GPYJPY_M15.png" width="947" height="920" border="0" /></a>


Hey Strat,

I have a few questions I hope you can help.

1) I turn all the Fractal S/R lines below H1 off. Do you think I need to incorporated those lower timeframe Fractal S/R lines?

2) I currently use the normal daily pivots with my M15 analyze chart and Fibonacci pivots with my M5 multi-trix chart. I really want to stick to one, but they both seem to be good. Do you think it's ok to continue like that or I should just stick to one. It seems you and all THV members recommended the Fibonacci pivots. I did see you use the daily pivots on Lesson 5, so I'm still debating on this. Do you have any additional comment?

3) Please take a look at the dashboard on the chart for this. I want to know if there is any way to move the pipware.com (v3.0) to the bottom right corner of the dashboard? As you see on the dashboard, I want to get rid of the white highlighted part. I can't do that because then the bottom row will overlap. Thanks.
 
 
  • Post #537
  • Quote
  • Jan 20, 2010 12:39am Jan 20, 2010 12:39am
  •  deadlyc
  • | Joined Dec 2009 | Status: Member | 7 Posts
I'm not sure the charts will get posted since I'm still a junior member. I have to head to bed, so I just attached them.
Attached Images (click to enlarge)
Click to Enlarge

Name: GBPJPY_M5.png
Size: 47 KB Click to Enlarge

Name: GPYJPY_M15.png
Size: 88 KB
 
 
  • Post #538
  • Quote
  • Jan 20, 2010 2:22am Jan 20, 2010 2:22am
  •  Mindsphere
  • | Joined Jul 2009 | Status: Member | 412 Posts
Hey strat - not sure if you've seen the problem with your trix rewrite, but the colour of the fast trix seems to be wrong on occasion. The minicharts show them correctly, however.
 
 
  • Post #539
  • Quote
  • Jan 20, 2010 2:35am Jan 20, 2010 2:35am
  •  stratman
  • | Commercial Member | Joined Jul 2009 | 1,436 Posts
Thanks, I didn't notice that ... I will investigate

Quoting Mindsphere
Disliked
Hey strat - not sure if you've seen the problem with your trix rewrite, but the colour of the fast trix seems to be wrong on occasion. The minicharts show them correctly, however.
Ignored
 
 
  • Post #540
  • Quote
  • Jan 20, 2010 2:40am Jan 20, 2010 2:40am
  •  stratman
  • | Commercial Member | Joined Jul 2009 | 1,436 Posts
Quoting deadlyc
Disliked
1) I turn all the Fractal S/R lines below H1 off. Do you think I need to incorporated those lower timeframe Fractal S/R lines?
Ignored
I made this so it suits any style eg swing trading, intraday, scalping. Just set what suits your style.

Quoting deadlyc
Disliked
2) I currently use the normal daily pivots with my M15 analyze chart and Fibonacci pivots with my M5 multi-trix chart. I really want to stick to one, but they both seem to be good. Do you think it's ok to continue like that or I should just stick to one. It seems you and all THV members recommended the Fibonacci pivots. I did see you use the daily pivots on Lesson 5, so I'm still debating on this. Do you have any additional comment?
Ignored
I'm still investigating this but use Fib pivots only for now

Quoting deadlyc
Disliked
3) Please take a look at the dashboard on the chart for this. I want to know if there is any way to move the pipware.com (v3.0) to the bottom right corner of the dashboard? As you see on the dashboard, I want to get rid of the white highlighted part. I can't do that because then the bottom row will overlap. Thanks.
Ignored
I will look into that.
 
 
  • Commercial Content
  • /
  • pipware.com
  • Reply to Thread
    • 1 2526Page 272829 153
    • 1 Page 27 153
0 traders viewing now
  • More
Top of Page
Forex Factory Blog Updated: Alerting All Members
  • Facebook
  • Twitter
About FF
  • Mission
  • Products
  • User Guide
  • Media Kit
  • Blog
  • Contact
FF Products
  • Forums
  • Trades
  • Calendar
  • News
  • Market
  • Brokers
  • Trade Explorer
FF Website
  • Homepage
  • Search
  • Members
  • Report a Bug
Follow FF
  • Facebook
  • Twitter

FF Sister Sites:

  • Metals Mine
  • Energy EXCH
  • Crypto Craft

Forex Factory® is a brand of Fair Economy, Inc.

Terms of Service / ©2022