DislikedHi Yourspace.
Just a quick look at your chart and some comments if they help.
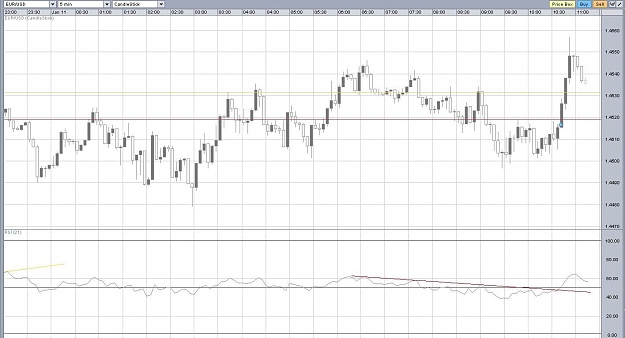
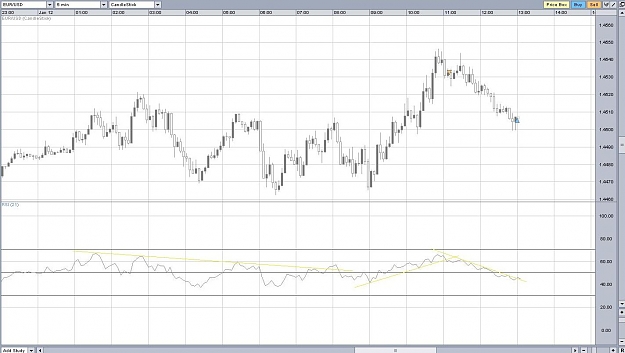
Your line 3(orange on the chart) is drawn under points on the rsi that are not formed by sharp price reversals. The decision as to where to draw them from is hard but can be made easy. Look for a sharp and definite price reversal on the candles - a rejection of price. If this is coupled with a bounce on the rsi from major 30 or 70 levels creating a peak or v on the rsi then better still. Look how the orange line was broken and you expected a sell but the price consolidated...Ignored
Thank you. I will look into your point. I think I will start to have the same number of candles for every post. I think this will help me and anyone who is reading the post.
I am very glad to hear about your new success in trading. And you are right I would have better off not taking the trade. Do be careful of demo trading, it also creats bad habits. I never demo trade. I think demo trading is useful to learn a new platform.
Take care,
Kareem
Trade Garlic