You're welcome. I should mention (about the SF Trendline indicator) that you should set it up like this:
Put it on your chart
Under Common Tab: Check the "Allow DLL imports" box
Under Inputs Tab: Set to the color you want
Under Visualization Tab: Uncheck "All TFs" and check "H1", otherwise each time you change TFs, it will draw a new trendline for each TF. If you like, you can have several drawn on your charts for different TFs in different colors, but the H1 is probably the best to use for our M15 swing trading.
After price breaks the trendline at least twice, you simply change to the H1 TF for a second and it will re-draw itself, updating the trendline.
Congrats to all in there trading. Good to see that the forum has come alive and everyone is interacting with one another and sharing there charts, and indis. We will all learn from each other , which will make us all better traders. Keep is simple and don"t change what has been working for you.
Good trading
PC
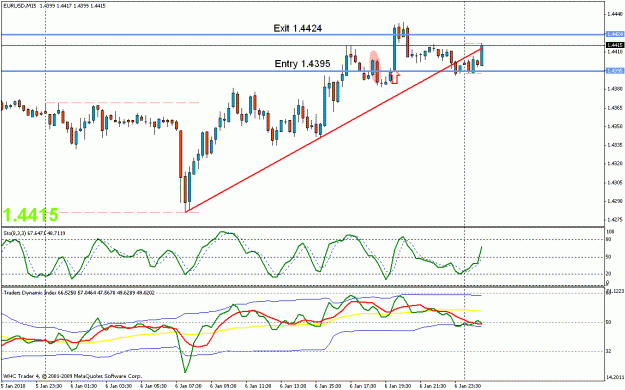
Here is an EU long trade on the 15m chart. Notice the pink circle. Here is what not to do. I entered long on the blue candle and the next candle dropped like a rock. Took a 20 pip beating on that entry. I knew I was in an up trend and I was anticapating the next up move, If you notice the indicators...the stoch hadn't hit the oversold area yet. A few candles later, indicators lined up and bang...long entry again doubling up my lots. Got 29 pips, so recouped my loss and then a few pips more.
I actually had the direction right but the entry a bit to early, so wait for the signal.
Joined May 2008
|
Status: Grand Poopaw
|1,488 Posts
It's great to see all the charts and discussion... we're heading in the right direction. This method is so simple, mechanical and there is no reason you all shouldn't be knockin' down the pips. Once you feel comfortable with it and the rules are commited to memory... it's a piece of cheese... and it works over and over and over, etc... Your all doing a great job and thanks for your input. Big E
Joined May 2008
|
Status: Grand Poopaw
|1,488 Posts
Ozzie...
Great post and explaination. Notice how effective Craigs rule is: to double up on the next swing to re-coop the loss. Works like a charm. Thanks again for posting. Re Post #445.
Here is an EU long trade on the 15m chart. Notice the pink circle. Here is what not to do. I entered long on the blue candle and the next candle dropped like a rock. Took a 20 pip beating on that entry. I knew I was in an up trend and I was anticapating the next up move, If you notice the indicators...the stoch hadn't hit the oversold area yet....
Ignored
Something Ive noticed and i think it applies a little to what happened to you is. The swings we look for are very much time based as well as s/r based. I almost got shaken out of a trade last night on g/u but since i was out in the middle of nowhere in the session time wise and had not made a full 30 pip swing so I anticipated that it was a fake out by the brokers. A false move up. Well the indicators did show that to and sure enuff it turned back to finish its path to s/r and then a reversal at the appropriate time.
Ill try to post live charts on this, but it pays to really pay attention to the time, if the current swing move finished its course (30-60 pips), and if u are at s/r level or just inbetween.
bulls
Whats happening in EUR/USD should be happening to you!
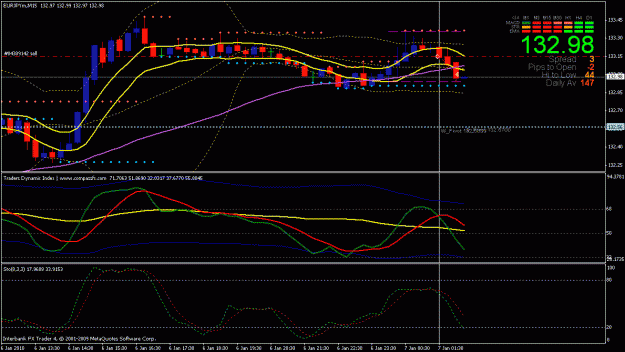
Here is a very nice setup, even though not out of asian session, I havent had much time this week to trade, so I try to make a few pips on asian session, got 15 so far on this short of eurjpy from 133.15 and took profit on half of my position and maybe it runs a bit, who knows, I also played off of my bollinger bands which isnt part of this method, so just ignore that and I also had an inside bar break for a good entry.
I mixed craig harris and tdi with my trading of price action, just read charts and they will tell you what to do as they are all telling us a story and we just have to decipher it, in my case, many times I look for inside bar breaks for change in momentum, and stoch or tdi or both usually confirm this, any questions just ask.
hlass
Hi all,... many times I look for inside bar breaks for change in momentum, and stoch or tdi or both usually confirm this, any questions just ask. hlass
Ignored
Hi HLass, a little more more info on IB breaks please. Chart if poss.
Hi HLass, a little more more info on IB breaks please. Chart if poss.
Thanks
Kolin
Ignored
Hi Kolin,
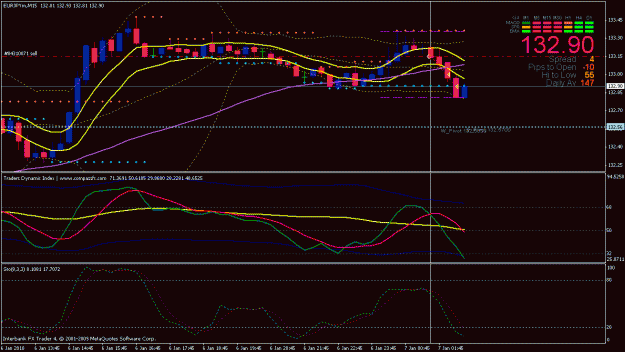
update on trade of eurjpy is 25 pips with about 35percent of position still in, I will post the pic.
Inside bars, I can explain to you very well and will help your trading but I want permission from Big E first before I intrude on the main trading technique here, if Big E says it is ok, then great I will give you a little write up as it has been a long day and quite tired, but I will write up a bit and then tomorrow I will go very detailed.
hlass
Hi Kolin,... if Big E says it is ok, then great I will give you a little write up as it has been a long day and quite tired, but I will write up a bit and then tomorrow I will go very detailed. hlass
Ignored
I am sure that any help for our trading will be agreed but I would be happy to have a PM of e-mail.
I haven't seen anyone ask about the settings of the TDI. Is the rsi period 13 and volatility band 34? Was wondering why the bands didn't use the standard bollinger band setting of 20? I don't think I've seen this addressed on the thread.