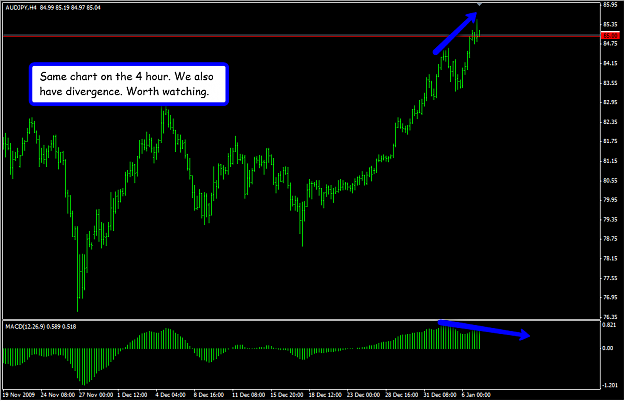
Certainly worth watching. I am willing to bet it decides on Friday. This contract can move fast - and cost you a ton quickly if you are not careful.....I would wait and let it do it's thing. When it moves - it will be obvious.
Not a bad book. I think it was referenced a few months ago by someone on this thread. He basically just follows a box-breakout system / momentum style trading system, buying breakouts and selling on breakdowns...
Ignored
That was me. Whenever I start to think trading is complicated I read the Darvas book and find out it is not. I have been trading breakouts off ascending triangles using Darvas' method in my demo account, testing it out. Waiting for a retrace is nice, but it seems more often than not there isn't a retrace to wait for and before you know the train has left the station never to come back... at least not for a good long while as its heading the other way.
I just finished reading Reminiscences again, for the third time, and you are right on with him saying once it passes $100 it will go higher. I think he said that during one of the times he was in Palm Springs fishing, only to see something happening in the market and head right back to NYC. Every time I read that book I take away something new, e.g., "general wisdom is never quite so valuable as specific savvy," or something to that effect.
My favorite thought out of that book was basically about exits. "If you are short, and get out....are you thinking you should be long?" Something like that.....
I had a pending trade under the base of yesterdays pinbar, it hasnt activated the trade, but has gone up to meet the downard trendline i have drawn. I have a s & r line at 0.910 which has acted as support, im going to hang with this pending trade. If it breaks and stays above the trendline , well......thats a different matter.
Nzd/Usd
This pending trade did activate, found support at 0.730 , saying that there are a bunch of bar highs under that area, its going to take a bit of muscle to get through it i think. Im going to let this one play out.
Sometimes it just a matter of being patient, then again NFP day is almost upon us.
Looking back i think these support areas were alway going to halt a drop, for now. If these pinbars closed under the pivot zone in my opinion we would of seen a good move.
I have just started on this thread. My first attempt to draw lines on the daily. Comments?
Ignored
Vicky - This is a weekly chart....but that's correct! You want to follow those lines. I would agree with this chart. It looks really good. Welcome to the thread!
Stick to weekly, remember strong s&r has seen action from above and below. Its almost like a flip from side to another, these flips can been days or weeks apart. zoom right out on your chart and drag a horizontal line down the chart.
When i first found out about s&r i used all the pairs on my platform , just to practice. If it doesnt jump out at you it proberly is not a very good s&r area or zone.
Notice i said zone/area. you will find that there could be a pivot point of 50 pips or more. Infact i think that pivot point is a good term to use, price does pivot to and from these lines.
Understanding pivot zones (s&r) was a real big turning point in my trading.
Some of my lines are months and months old, and price still respects them . Is this by chance, or is it some kind of constant?
Use the lines sparingly, but make a mental note of round numbers, price can react off them too.
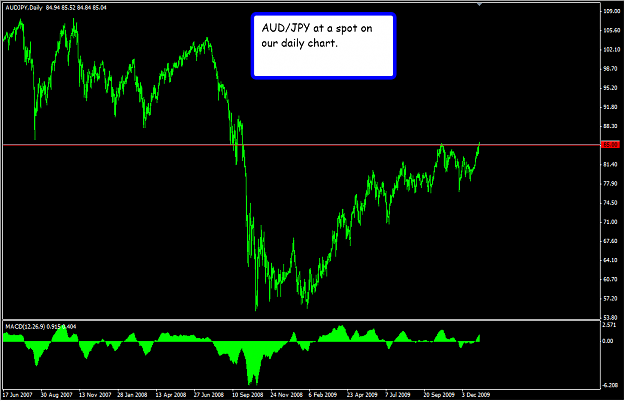
The trendline on AUDUSD is even prettier, it hasn't been violated at all. Things may be shaping up for dollar bulls.
Ignored
Hi 0990|6mh and Chris,
I had similar thought and had was thinking of selling at 50% retracement of that daily candle ( see attached). But looks like it went back up and took the top of that candle off ( which would have been my SL). I am still paper trading so nothing lost :-).
What is the best way to manage such trades when market goes back in the direction opposite to suggested by pinbar signal at SR levels? Do we go bullish above that candle and buy? Any suggestions from your experiences?
Appreciate your comments.
Ignored
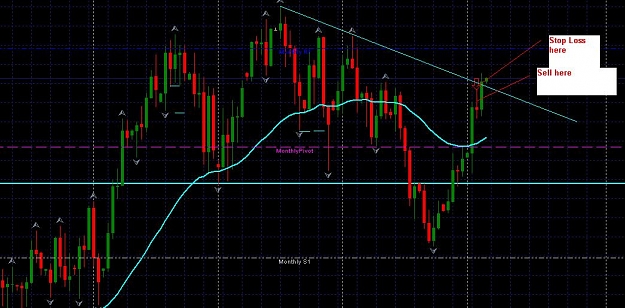
NORMALLY - YES......you would be looking the other direction. However.....in my case, it's based off two monthly pinbars in a row, which "trumps" that signal.
NORMALLY - YES......you would be looking the other direction. However.....in my case, it's based off two monthly pinbars in a row, which "trumps" that signal.
Ignored
Thanks Chris !!
Looking at fundamentals, economy and real estate market is going well and there is more support for IR increases and hence higher AUDUSD. But quite possible we have already overbought. Will be interesting to see how high AUDUSD goes before turning around.
Lost big on this pair yesterday, the 2 Day PB refused to work but i suspect the News might had something to do with it as it stalled for quit sometime.
Everyone be careful today, as NFP is tomorrow. If you are not in a position already, I wouldn't be looking for one today. Tomorrow is going to be too important to guess ahead of time.....
Lost big on this pair yesterday, the 2 Day PB refused to work but i suspect the News might had something to do with it as it stalled for quit sometime.
Ignored
According to my charts, that 2 day bar didn't break down, which is always the safer thing to do.....react, don't anticipate.
Everyone be careful today, as NFP is tomorrow. If you are not in a position already, I wouldn't be looking for one today. Tomorrow is going to be too important to guess ahead of time.....
Ignored
Sitting on my hands this week. May make some popcorn for NFP and then it will be back to work for me next week. I'm keeping it oh so simple.
Vicky - This is a weekly chart....but that's correct! You want to follow those lines. I would agree with this chart. It looks really good. Welcome to the thread!
Chris
Ignored
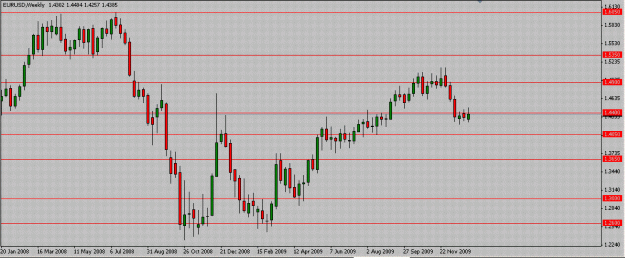
Oh, that is weekly My bad. I have been reading the thread slowly and steadily, 10 pages a day. BTW, did you play the bounce off the 1.4 ??
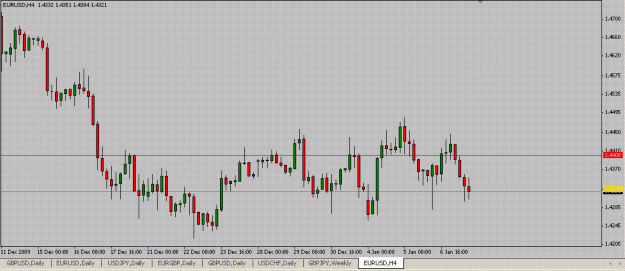
I drew another line near the 1.4 and it seems the prices are reacting more to 1.425. So, a SR zone , right?
Stick to weekly, remember strong s&r has seen action from above and below. Its almost like a flip from side to another, these flips can been days or weeks apart. zoom right out on your chart and drag a horizontal line down the chart.
When i first found out about s&r i used all the pairs on my platform , just to practice. If it doesnt jump out at you it proberly is not a very good s&r area or zone.
Notice i said zone/area. you will find that there could be a pivot point of 50 pips or more. Infact i think that pivot point is a good...
Ignored
Warren, Thanks for all the advice. I have been reading your posts and looks like, you use fib confluence into consideration to take trades?