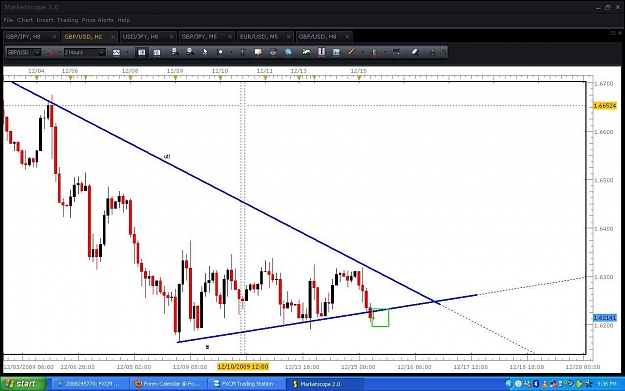
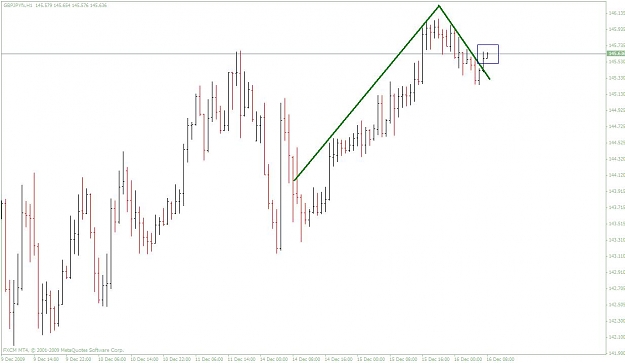
DislikedBro please check these both charts you can see in chart 1 all SMA are up RSI is indicating to go up and MACD also turning its line..and 5 days moving average already tested so next target can be 10 and then 15 days and you can see in 2nd chart its trying to break support 6165 and 6200 2- times it istested and now its not intrested to broke it or test it you can see yesterday makret opened and make new low but since that time she haven't tried to teest it again and unable to broke that trend line so what its means??its trying to go up or building...Ignored
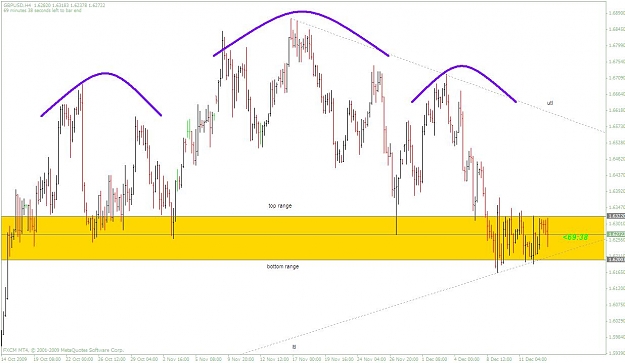
Wider view shows a massive H&S in the works, but won't be valid unless price close below the ltl & bottom range. It's not going up either since price is well contained below the top range. I think you'd be better off trading the range instead of guessing. It's a hundred pip range mind you
Attached Image (click to enlarge)
Thank You