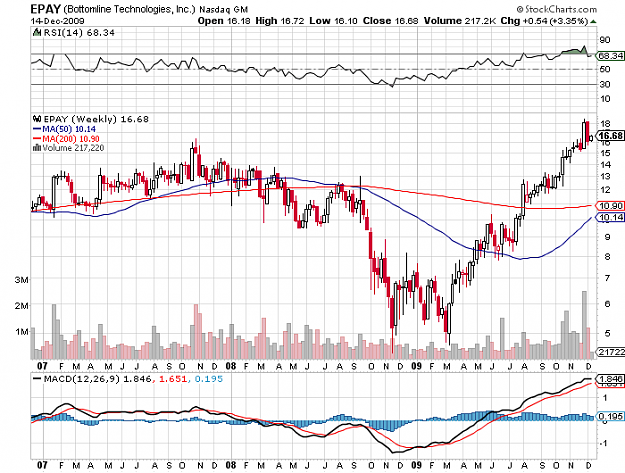
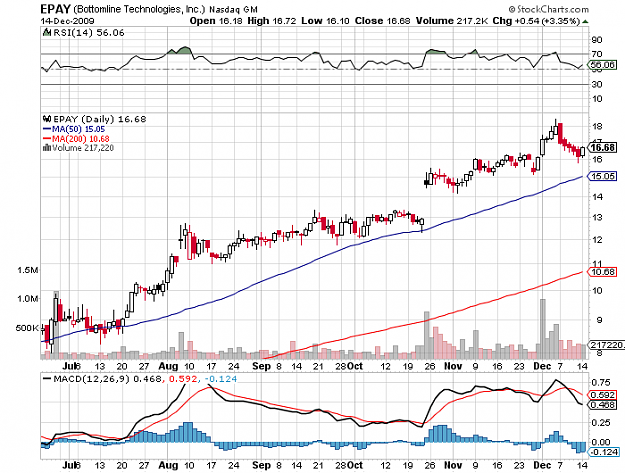
Ran across this stock while looking at my volume filter. It burst through resistance around $16 on December 1st and has now retraced back to support and has bullish PA. You cannot see it on these charts, but it is also on its 20 day MA. Looking further back in time, not included on the weekly posted here, there is a solid top at $18, which explains the convincing fashion in which $18 is rejected on this weekly chart. So perhaps this could be a better shorting opportunity than long. Maybe wait for it to retrace against the bearish weekly PA and wait for a bearish entry signal on the daily. If it goes past $18, wait for retrace and bullish PA at $18. I will be watching............ Thoughts welcome as always.
Attached Image(s) (click to enlarge)