I have a question ... how do we know that USD will not break down through support like it did on the previous breakout? The previous breakout has the same pattern except that it breaks back down.
I think the answer to my question is ... we don't know for sure.. do we?
Anyway, I agree with the direction and am also long the dollar.
Ignored
Agree with previous poster. We do not know. All we can do is watch and see. Price may even pierce support. Obviously the pair you are long of matters most. For my money, I will set my stop accordingly and be ready to add to my position if/when there is bullish PA at the support level. I am long UJ and have my stop at b/e.
As an aside, it is my impression that trading forex is to trading stocks as riding a bull is to riding a bronco (or perhaps a semi-broken horse). Definite differences with chief among them being that forex is more unpredictable and more in flux as it makes its way from point A to point B. Stocks seem to be more well behaved on average. I think if you can trade forex successfully, and master the emotional ups and downs it causes, then trading stocks should be easier. I don't know, maybe the fact that stocks have the much more discrete daily TF has something to do with this impression.
I got into this game after coming to the conclusion that my financial adviser was no more an adviser than she was a race car driver. Indeed, she and others of her ilk are nothing more than salespeople. I knew and continue to firmly believe that an individual willing to take the time to educate him or herself, and assuming a modicum of intelligence and emotional control, will almost always do better managing their own funds than a "financial product salesperson." I am now just over one year in to this experiment and feel I am finally beginning to see some light. Things seem to be starting to "click" in my mind. I am looking forward to the new year and where I think I can take all of this new found knowledge. Chris and James16, thank you for your contributions to my progression.
Hi Chris
how about oil ? look like it s heading down . are u watching it too ?
thanks
Ignored
I am actually. I am not planning on trading the CL...(crude) but possibly QM. (Mini oil futures.) I am not sure yet. I also am paying attention to it to see if it is going to track the dollar, and show up in other commodity areas as well. (Higher Dollar = Lower Corn for example.) Oil is a pretty good indicator most of the time for Dollar strength.
I have a question ... how do we know that USD will not break down through support like it did on the previous breakout? The previous breakout has the same pattern except that it breaks back down.
I think the answer to my question is ... we don't know for sure.. do we?
Anyway, I agree with the direction and am also long the dollar.
Ignored
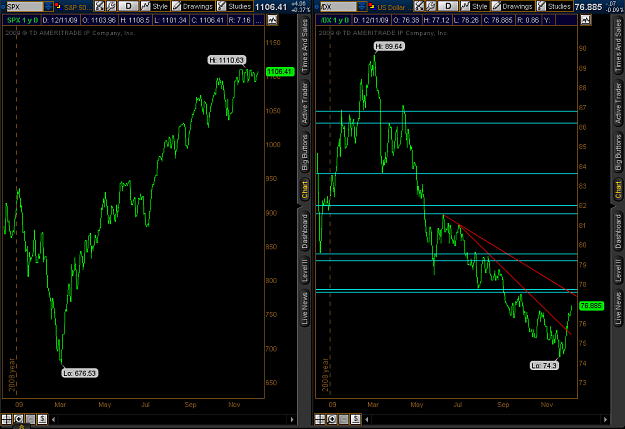
Take a look at 76.80, which is the top of this week's bar, and the top of that pinbar a while back - that is the next hurdle to go higher. Will it? We don't know....only time can show us that.
You are 100% correct. Financial Advisers often know very little about how to trade. In fact, most only know which Mutual Funds to buy if they are lucky.
If there were shares in Tiger Woods I would be buying right about now!
Ignored
I agree.....but it would certainly be a "buy and hold" deal, as I think it would take a couple of years to get your full return. He will be back though.....you can count on that.
Could this be the decoupling of the Equities and dollar. Notice that both the SPX and the USD index were both up on Friday. Who knows, the inverse relationship might be coming to an end. Let's watch and see what the charts tell us.
I've also shown my levels on the /DX. Let's see if we respect those levels.
Chris
i was checking your chart of the week on your site .
and i was glad to see that the short i have entered was conform to your teaching .
by the way i entered long on another account around 1.47 a counter trend trade because i was thinking that it might visit at least 1.4850 or even 1.4900 to confirm it as a resistence . but that long failed and was closed at BE . i still beleive it might later visit these levels .
the short trade is it still on .
thanks
samer
Ignored
One thing that could help push this pair down for another bit is the factit's the end of the year. Maybe we shall see some more profit taking by the firms that went long earlier this year?
Could this be the decoupling of the Equities and dollar. Notice that both the SPX and the USD index were both up on Friday. Who knows, the inverse relationship might be coming to an end. Let's watch and see what the charts tell us.
I've also shown my levels on the /DX. Let's see if we respect those levels.
Kulu
Ignored
I think that late last week we may have seen the start of that decoupling you are talking about. Certainly something had changed.
Only time will tell. Truthfully, I am more interesting in being long USD than stocks now....so hopefully it will make itself obvious before any more stock trades are placed in my account.