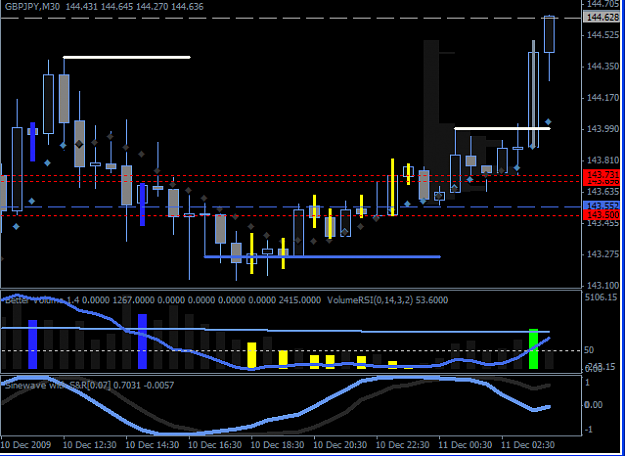
• Home
  • Forums
  • Trades
  • News
  • Calendar
  • Market
  • Brokers
  • Login
  • Join
  • User/Email: Password:
  • 4:56pm
Menu
  • Forums
  • Trades
  • News
  • Calendar
  • Market
  • Brokers
  • Login
  • Join
  • 4:56pm
Sister Sites
  • Metals Mine
  • Energy EXCH
  • Crypto Craft

Options

Bookmark Thread

First Page First Unread Last Page Last Post

Print Thread

Similar Threads

Volume Spread Analysis (VSA) and background 5 replies

Trading With VSA - Volatile Volume and Spread Analysis 9 replies

What is the best VSA (Volume Spread Analysis) system/indicator? 1 reply

Volume Spread Analysis (VSA) and the EURUSD 3 replies

VSA Volume Spread Analysis: No demand and accumlation 2 replies

  • Commercial Content
  • /
  • Reply to Thread
  • Subscribe
  • 2,519
Attachments: Trade Using VSA (Volume Spread Analysis)
Exit Attachments

Trade Using VSA (Volume Spread Analysis)

  • Last Post
  •  
  • 1 214215Page 216217218 445
  • 1 Page 216 445
  •  
  • Post #4,301
  • Quote
  • Dec 10, 2009 3:44pm Dec 10, 2009 3:44pm
  •  chief1oar
  • Joined May 2009 | Status: Account Closed | 69 Posts
Quoting Ace
Disliked
Accumulation GJ??


Can anyone tell me how to write text and on my charts WITHOUT IT DISAPPEARING MT4
Ignored

Ace -

One of your indicators is using an ObjectsDeleteAll() command which will delete any text objects, arrows etc. you put up. (Bad).

TC East has best solution unless you want to change the code. If you need help, pm me.

Chief
 
 
  • Post #4,302
  • Quote
  • Dec 10, 2009 9:35pm Dec 10, 2009 9:35pm
  •  hanindo2000
  • | Joined Nov 2007 | Status: Member | 19 Posts
Quoting denbur
Disliked
Hi Hanindo,

Yes, time stop depends on the time frame you use. However, you have to go through your own trading records to find out the right time for you. Look back through your trades and see how fast your winning trades went into the profit after you executed them and how much time you spent in a losing trade. That also depends on how accurate you can plan you entry.

This may not work for you unless you know when to enter.

The idea behind it is the order flow. If you sold and supply does not show itself, stopped or there is no...
Ignored

Thanks for your explanation ,makes my mind more clear,I will learn again about my trade.
 
 
  • Post #4,303
  • Quote
  • Dec 10, 2009 10:09pm Dec 10, 2009 10:09pm
  •  Ace
  • | Joined Aug 2009 | Status: Pip Stalker | 55 Posts
Quoting TC East
Disliked
Not really sure what you mean by it disappearing, but what I do is the following if it will help:

1) Insert>>Text
2) Click on chart where I want to write
3) Write text I want in the "Text" entry in little box that comes up
4) Click OK
5) File>>Save as Picture

That's it; I then have the picture saved with the text I wrote. No expert at this, but just sharing what works for me; hope it helps...
Ignored
Thanx will give it a shot
 
 
  • Post #4,304
  • Quote
  • Dec 10, 2009 10:11pm Dec 10, 2009 10:11pm
  •  Ace
  • | Joined Aug 2009 | Status: Pip Stalker | 55 Posts
Quoting chief1oar
Disliked
Ace -

One of your indicators is using an ObjectsDeleteAll() command which will delete any text objects, arrows etc. you put up. (Bad).

TC East has best solution unless you want to change the code. If you need help, pm me.

Chief
Ignored
Really thats not good cuz i dont wanna go thru all those indi codes!!
 
 
  • Post #4,305
  • Quote
  • Dec 10, 2009 10:13pm Dec 10, 2009 10:13pm
  •  Ace
  • | Joined Aug 2009 | Status: Pip Stalker | 55 Posts
i Got out too early @ 144.00 could have waited for it reach R1
Attached Image (click to enlarge)
Click to Enlarge

Name: Screen shot 2009-12-10 at 7.10.07 PM.png
Size: 34 KB
 
 
  • Post #4,306
  • Quote
  • Dec 11, 2009 3:07am Dec 11, 2009 3:07am
  •  Ace
  • | Joined Aug 2009 | Status: Pip Stalker | 55 Posts
Hanindo, i really like the time stop concept, when you say depends on how much supply/ demand you have are you counting actual supply / demand bars in a given direction over the period of time frame your trading?

cutting loses is a focal point for me but i still struggle with it..
 
 
  • Post #4,307
  • Quote
  • Dec 11, 2009 7:21am Dec 11, 2009 7:21am
  •  tfflyer
  • | Joined Sep 2007 | Status: Member | 1,404 Posts
Hi,
would like to hear expierenced trader comments.

We can see excesive volume on downbar but its not possible to broke last low - could this be weakness than ?
Because, i think, if there was such volume on down, then it should broke last low..

BUT.. Folowing up moves is on VERYYY LOW volume.. That says me also another story..

So not sure to whom believe

BUT to say my conclusion in this moment i would say :

Strong bars in background. And now weakness before markdown.. And then Bullish will take trend.


Thanks !


Best,
Tom
Attached Image (click to enlarge)
Click to Enlarge

Name: 6B 12-09  12_11_2009 (60 Min).jpg
Size: 63 KB
 
 
  • Post #4,308
  • Quote
  • Dec 11, 2009 2:46pm Dec 11, 2009 2:46pm
  •  denbur
  • | Joined Sep 2008 | Status: Member | 96 Posts
Quoting tfflyer
Disliked
Hi,

We can see excesive volume on downbar but its not possible to broke last low - could this be weakness than ?
Because, i think, if there was such volume on down, then it should broke last low..

BUT.. Folowing up moves is on VERYYY LOW volume.. That says me also another story..
Ignored
Tom,

Bar by itself is full of supply in my opinion. Plus there are weak up bars to follow and couple of failed attempt to stop the down move.

Market is breaking bigger support and still have supply in it....

It all can change if new volume comes on up bars.
 
 
  • Post #4,309
  • Quote
  • Dec 11, 2009 2:51pm Dec 11, 2009 2:51pm
  •  Dr.Geppynius
  • Joined May 2008 | Status: has long shorts | 2,584 Posts
the low volume u see is because of the end of the contract month.

futures contract ends the third friday of the contract month. rollover begins on the second thursday of this month. volume now shifts to the following contract month (e.g. ESH10 for s&p emini march 2010)

Quoting tfflyer
Disliked
Hi,
would like to hear expierenced trader comments.

We can see excesive volume on downbar but its not possible to broke last low - could this be weakness than ?
Because, i think, if there was such volume on down, then it should broke last low..

BUT.. Folowing up moves is on VERYYY LOW volume.. That says me also another story..

So not sure to whom believe

BUT to say my conclusion in this moment i would say :

Strong bars in background. And now weakness before markdown.. And then Bullish will take trend.


Thanks !


Best,
Tom
Ignored
 
 
  • Post #4,310
  • Quote
  • Dec 11, 2009 2:59pm Dec 11, 2009 2:59pm
  •  Dr.Geppynius
  • Joined May 2008 | Status: has long shorts | 2,584 Posts
60m tf is way too big for entries on futures tom, since we only have a limited period of high vol action. even on 15m we often have completion of swings inside.

see attached chart, i just marked some key areas. we continue to fail to break resistance, nevertheless uptrend is in play. rallies look weak so far.


Quoting tfflyer
Disliked
Hi,
would like to hear expierenced trader comments.

We can see excesive volume on downbar but its not possible to broke last low - could this be weakness than ?
Because, i think, if there was such volume on down, then it should broke last low..

BUT.. Folowing up moves is on VERYYY LOW volume.. That says me also another story..

So not sure to whom believe

BUT to say my conclusion in this moment i would say :

Strong bars in background. And now weakness before markdown.. And then Bullish will take trend.


Thanks !


Best,
Tom
Ignored
Attached Image (click to enlarge)
Click to Enlarge

Name: 11.12.png
Size: 270 KB
 
1
  • Post #4,311
  • Quote
  • Dec 12, 2009 11:34am Dec 12, 2009 11:34am
  •  tfflyer
  • | Joined Sep 2007 | Status: Member | 1,404 Posts
Thanks Dr. G. for comments.

Looks like i forgot to look for some simple TA..

Thanks

Best,
Tom
Quoting Dr.Geppynius
Disliked
60m tf is way too big for entries on futures tom, since we only have a limited period of high vol action. even on 15m we often have completion of swings inside.

see attached chart, i just marked some key areas. we continue to fail to break resistance, nevertheless uptrend is in play. rallies look weak so far.
Ignored
 
 
  • Post #4,312
  • Quote
  • Dec 12, 2009 11:41am Dec 12, 2009 11:41am
  •  tfflyer
  • | Joined Sep 2007 | Status: Member | 1,404 Posts
Thank You Den for comments !

Best,
Tom


Quoting denbur
Disliked
Tom,

Bar by itself is full of supply in my opinion. Plus there are weak up bars to follow and couple of failed attempt to stop the down move.

Market is breaking bigger support and still have supply in it....

It all can change if new volume comes on up bars.
Ignored
 
 
  • Post #4,313
  • Quote
  • Dec 13, 2009 11:02am Dec 13, 2009 11:02am
  •  5abi
  • Joined Apr 2009 | Status: Technical Artist | 1,609 Posts
good day folks,

for those who are newer to vsa (like me), it is important to stick to a few pairs. Ideally not more than two- I am very comfortable with GU and GJ and their moves are pretty decent so that will take care of point targets; ofcourse, that may be more disastrous too if you dont know what you are dealing with.

Then I feel, it is important that you stick to a fewer vsa patterns, or set ups or bars in the beginning. I say this because understanding it all could be overwhelming at first- so just take it as a course- one chapter at a time and let it unfold. In my case I picked up a very repeatable "pattern" as you will see in the charts below. I watch this setup happen patiently and only take the vsa trades on this occurring.

Thirdly, read this forum thoroughly, most of the traders here are very good at vsa and you must read master the markets. It is commonly available online.

Okay now on to my charts...there are areas marked on the charts below. I just wait for these setups to happen. dont jump in before they have happened. my reasoning is as follows:

an up bar (or a down bar) that has unusually high volume (and high spread) that fails to "follow up" into a new higher (or lower) territory is a prime candidate for reversal. most often than not, if the volume on these 2 bars is equivalent or close to being equivalent, it is almost 100% that it will reverse. You will see these on all time frames, but I use M5 and M15 for vsa as I feel that is the lowest level of granularity at which the trades are being taken. Also at pre-determined times daily high volumes and low volumes are common on the higher TF (For example the H4 bar ending at 8 AM EST will alwys have high volume) but looking at the M5 and M15 in relation to previous bars makes all the difference.

the chart just shows a few such setups but if you scroll back you will see them all over the place.

For stops I use the low of the preceding candle. the swing high or the swing low, just one bar back.
Attached Image (click to enlarge)
Click to Enlarge

Name: snapshot-1.jpg
Size: 151 KB
Its all in the mind.
 
 
  • Post #4,314
  • Quote
  • Dec 13, 2009 4:55pm Dec 13, 2009 4:55pm
  •  rbumbalough
  • | Joined Feb 2009 | Status: Member | 286 Posts
Hello Friends

I'm confused on what a failed test would look like or appear as. Any VSA guru that cares too describe failed tests for demand and supply will earn a bit of gratitude from me.

The Trade Guider Indicator document records that "A failed test looks like an ordinary test but the volume is too high." p.19 and that a test is "A rapid mark down coming back to close on the highs - especially if the lows are down into fresh new ground. If the volume is low volume this adds to the strength. The news should be 'bad news'." p.44

My understanding of a failed supply test consists of a rapid mark down followed by a close on or near the high with average or greater volume whereas a failed demand test is a rapid mark up with a close near the low and with average or greater volume.

Is that correct? If not what does constitute a failed test and how does it differ from shake outs or reverse up-thrusts?

Thank you for your kind consideration.

***********************************
"The Objectivist ethics proudly advocates and upholds rational selfishness—which means: the values required for man’s survival qua man—which means: the values required for human survival—not the values produced by the desires, the emotions, the “aspirations,” the feelings, the whims or the needs of irrational brutes, who have never outgrown the primordial practice of human sacrifices, have never discovered an industrial society and can conceive of no self-interest but that of grabbing the loot of the moment.
The Objectivist ethics holds that human good does not require human sacrifices and cannot be achieved by the sacrifice of anyone to anyone. It holds that the rational interests of men do not clash—that there is no conflict of interests among men who do not desire the unearned, who do not make sacrifices nor accept them, who deal with one another as traders, giving value for value." ~ Ayn Rand

http://cultureofreason.org/style/img/thevirture.jpg “The Objectivist Ethics,” The Virtue of Selfishness, 31.
 
 
  • Post #4,315
  • Quote
  • Dec 13, 2009 9:15pm Dec 13, 2009 9:15pm
  •  rbumbalough
  • | Joined Feb 2009 | Status: Member | 286 Posts
How would VSA analyze this bottom reversal?
********************************************

http://www.forexfactory.com/attachme...5&d=1260756762
Attached Image (click to enlarge)
Click to Enlarge

Name: bottomreversal.jpg
Size: 74 KB
 
 
  • Post #4,316
  • Quote
  • Dec 13, 2009 9:32pm Dec 13, 2009 9:32pm
  •  hanindo2000
  • | Joined Nov 2007 | Status: Member | 19 Posts
Quoting 5abi
Disliked
good day folks,

for those who are newer to vsa (like me), it is important to stick to a few pairs. Ideally not more than two- I am very comfortable with GU and GJ and their moves are pretty decent so that will take care of point targets; ofcourse, that may be more disastrous too if you dont know what you are dealing with.

Then I feel, it is important that you stick to a fewer vsa patterns, or set ups or bars in the beginning. I say this because understanding it all could be overwhelming at first- so just take it as a course- one chapter at a...
Ignored

Hi 5abi,

I just notice that you using better volume indicator in esignal platform ,can you post the indicator in this forum,thanks
 
 
  • Post #4,317
  • Quote
  • Dec 14, 2009 6:22am Dec 14, 2009 6:22am
  •  HiddenGap
  • Joined Aug 2009 | Status: Reading the tape | 2,297 Posts
Quoting rbumbalough
Disliked
...I'm confused on what a failed test would look like or appear as. Any VSA guru that cares too describe failed tests for demand and supply will earn a bit of gratitude from me......
Ignored
The pic below shows two tests.

The basic, or ideal test, will be a narrow range down candle closing in the middle or near the high of its range on volume less than the previous two candles. A and A' are two examples of this.

To be confirmed, one of the next two candles should close up and close higher than the high of the close of the test. B and B' confirm their respective test candles.

THERE ARE TWO MAIN WAYS A TEST CAN FAIL:

1. Volume can be high on the test candle/bar. Again, ideally volume will be less than the previous two. If volume is increasing and high then there is still residual supply and the market is likely to go down. IF the market goes up, the move will usually be muted and a then fall back down into the area of the test and re-test. This second test to be successful will have volume less than the previous two candles and the previous test as well.

2. If neither of the next to candles/bars after the test are able to close higher than the test candle, the test has failed.

*** If the candle immediately following the test is up and does not make a lower low than the test candle, then the test is good. If the candle after that closes lower than the test candle, we would be looking at a good test but with no result. Or simply no results from a test.***

P.S. The above pic is not a test nor a failed test.
Attached Image (click to enlarge)
Click to Enlarge

Name: ex2.png
Size: 79 KB
The Market is either drawing to liquidity or running to an imbalance.
 
1
  • Post #4,318
  • Quote
  • Edited Dec 16, 2009 3:47am Dec 15, 2009 5:58pm | Edited Dec 16, 2009 3:47am
  •  tfflyer
  • | Joined Sep 2007 | Status: Member | 1,404 Posts
This question goes to those who are profitable making profit using VSA..


How long does it tooked to You to be profitable with VSA and how was that journay to that..?


I am ~7 month learning already VSA.. and before that 2.3 years all other things... You know...

Offcourse, i will learn as much as i will need, but just interested how long it tooked for those who is profitable already

EDIT:
I KNOW THAT EVERYONE IS DIFFERENT, I AM JUST ASKING ABOUT OTHERS... THAT ALL...


Thank You.

Best,
Tom
 
 
  • Post #4,319
  • Quote
  • Dec 15, 2009 7:57pm Dec 15, 2009 7:57pm
  •  5abi
  • Joined Apr 2009 | Status: Technical Artist | 1,609 Posts
..chart later
Its all in the mind.
 
 
  • Post #4,320
  • Quote
  • Dec 15, 2009 9:06pm Dec 15, 2009 9:06pm
  •  5abi
  • Joined Apr 2009 | Status: Technical Artist | 1,609 Posts
cant speak for anyone, but I just started vsa (about a month or so). So far Vsa trades are in the green, but then a month is not a "definitive" period, statistically.


I dont think you can learn it---it is what you see that matters. same bar, same time frame, different people see different possibilities. Below is a GJ trade I took last night, 140 pips. One look and it is clear (to me) that this is no selling here...


Quoting tfflyer
Disliked
This question goes to those who are profitable making profit using VSA..


How long does it tooked to You to be profitable with VSA and how was that journay to that..?


I am ~7 month learning already VSA.. and before that 2.3 years all other things... You know...

Offcourse, i will learn as much as i will need, but just interested how long it tooked for those who is profitable already


Thank You.

Best,
Tom
Ignored
Attached Image (click to enlarge)
Click to Enlarge

Name: snapshot-2.jpg
Size: 151 KB
Its all in the mind.
 
 
  • Commercial Content
  • /
  • Trade Using VSA (Volume Spread Analysis)
  • Reply to Thread
    • 1 214215Page 216217218 445
    • 1 Page 216 445
0 traders viewing now
  • More
Top of Page
Forex Factory Blog Updated: Alerting All Members
  • Facebook
  • Twitter
About FF
  • Mission
  • Products
  • User Guide
  • Media Kit
  • Blog
  • Contact
FF Products
  • Forums
  • Trades
  • Calendar
  • News
  • Market
  • Brokers
  • Trade Explorer
FF Website
  • Homepage
  • Search
  • Members
  • Report a Bug
Follow FF
  • Facebook
  • Twitter

FF Sister Sites:

  • Metals Mine
  • Energy EXCH
  • Crypto Craft

Forex Factory® is a brand of Fair Economy, Inc.

Terms of Service / ©2022