DislikedHey Den,
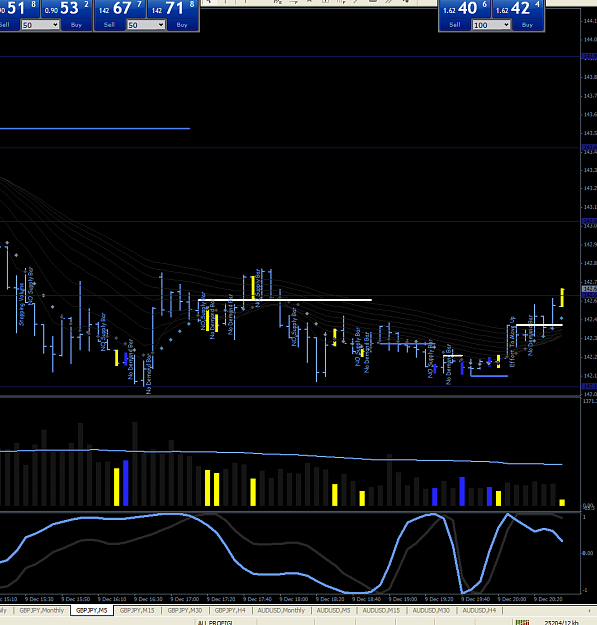
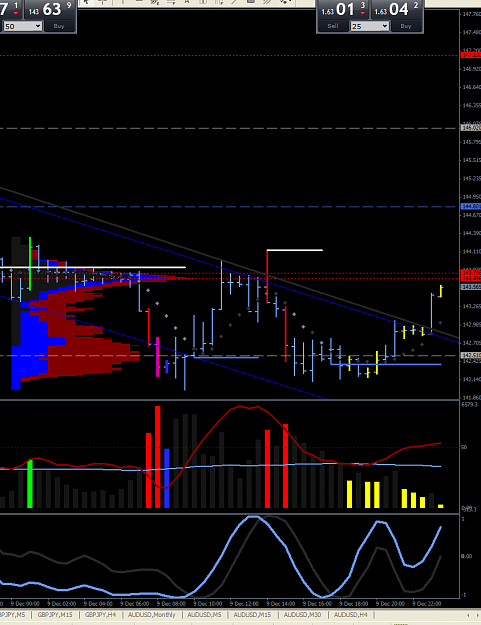
i marked the bar which i tough is strenght. ( its yesterday G/U )
But there was no real following - so we can assume that this is weakness ?
And if so, in which place we start to look for shorts when STRENGHT fails ?
Thanks.
Best,
TomIgnored
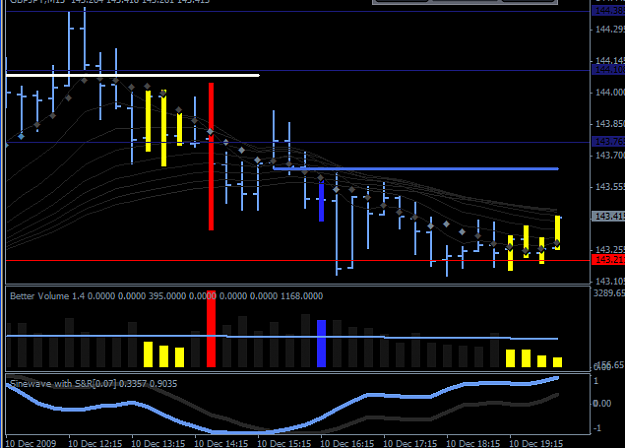
may a take a shot at this one... If the false strength turned out to be weakness to the left..Could the stop reverse be on one of those No demand Bars???