Like a lot of people on this forum I have been able to learn a lot by everyone's contribution to new forex trading ideas and concepts etc etc. I thought I would take the time to share a very simple system that has served me well over the last couple of years. I think the biggest reason it has worked so well is that it is based almost entirely on price action and some very simple ninja trader indicators.
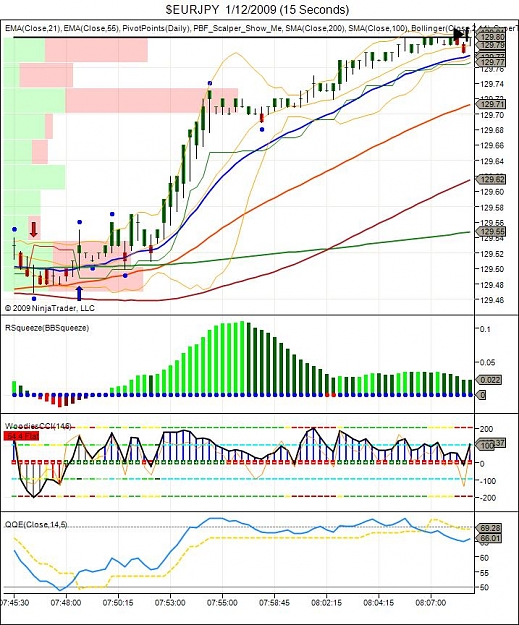
It's a simple strategy. What you are basically looking for is a trend within a trend. This is why I call it the Micro Trend Scalping System. After a lot of trial and error, I came up with the 2 time frames that seem to work the best. The main time frame I use is the 1 minute, with the 15 second time frame in an identical template right next to the 1 minute. I like this system so much because I have been able to incorporate it into other charts and systems I have running at the same time.
Daily Profit Potentials: Around 30-50pips +
All you need to do is the following:-
1. Create 1 minute chart with indicators suggested.
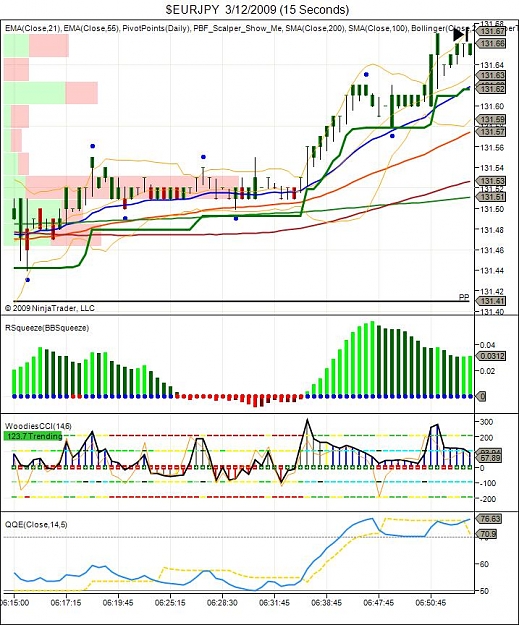
2. Create 15 second chart with suggested indicators.
3. Ascertain what the prevailing trend is for the session you are going to trade.
4. Ensure you have enough volume and momentum with the pair you are going to trade. I trade the EURJPY and EURUSD on account of the low spread I get.
That's it! Once you have all this set up you are ready to go.
Ideal Targets: Around 5-10 + pips or else when you get to 10 pips, take half the lots off as profit and let the rest run, putting your stop loss at break even, or trail it at the 1 minute or 15 second super-trend stop loss line.
My trading style
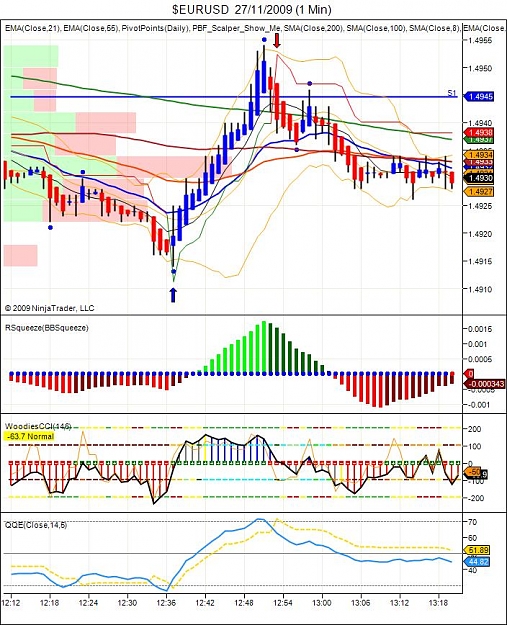
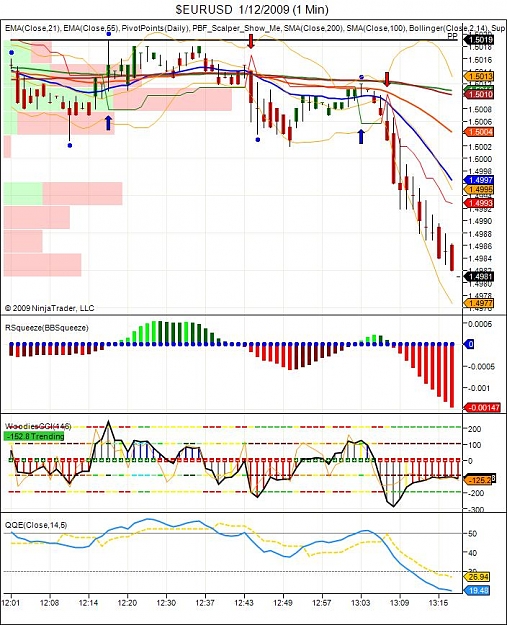
I have included 2 pictures to give you an idea how I trade this system. I have used the EURUSD today as there has been a lot of dollar strength and the pair has been in a pretty good downtrend most of the Asian session.
So once I am convinced I have enough volume and momentum for the trending pair I have selected I am then ready to go. This part is very important, on account if the pair you want to trade is choppy showing no prevailing trend, it would be a good idea to look for a pair that is trending, or just waiting the chop out.
Back to the trading. So if you look at the 1 minute chart you will see in the middle of the chart a good pull back from the prevailing trend, it's peak is hit at about 12:50 on the chart.
What I am looking for now is my first trigger, and that happens at about 12:52 on the chart. The super-trend indicator gives a short signal on the 1 minute chart. Once we get that signal we are almost ready to pull the trigger.
Pulling the trigger
Now at this point, pulling the trigger becomes very discretionary, meaning there are a few different ways to enter depending on how aggressive you want to be, as you learn and practice with this system you will see what I mean, and I will share these other entries at a later date if this thread continues.
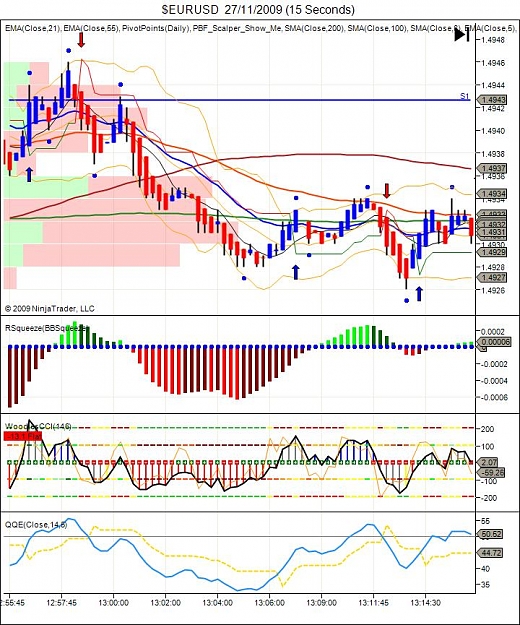
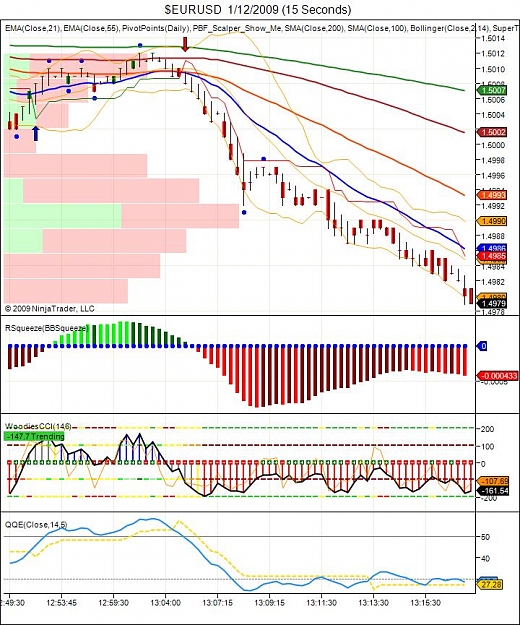
I have found that the best entry is the following. After you receive intial signal from the 1 minute chart, you now go to the 15 second chart and a wait the same signal. In this example it happens at about 12:58. Your stop loss becomes any time the super-trend line is completely violated by a closing bar. On this trade you can see this happens at about 13:06.
Like I mentioned, there are alternative stop loss areas and trade entries. I will cover these later if there is interest.
Ninja chart indicators ( free of charge )
www.greattradingsystems.com/Ninja Trader Indicators/
The following is what I have on my charts:
EMA (Close, 21)
EMA (Close, 55)
RSqueeze (BBSqueeze)
PBF-Scalper-Show-Me
SMA (Close,200)
SMA (Close, 100)
Bollinger (Close, 2,14)
Super Trend (14,2.618,True)
VolumeZones (Close,10,1, False, 80)
WoodiesCCI (14.6)
QQE (Close, 14,5)
HeikenAshi
It's a simple strategy. What you are basically looking for is a trend within a trend. This is why I call it the Micro Trend Scalping System. After a lot of trial and error, I came up with the 2 time frames that seem to work the best. The main time frame I use is the 1 minute, with the 15 second time frame in an identical template right next to the 1 minute. I like this system so much because I have been able to incorporate it into other charts and systems I have running at the same time.
Daily Profit Potentials: Around 30-50pips +
All you need to do is the following:-
1. Create 1 minute chart with indicators suggested.
2. Create 15 second chart with suggested indicators.
3. Ascertain what the prevailing trend is for the session you are going to trade.
4. Ensure you have enough volume and momentum with the pair you are going to trade. I trade the EURJPY and EURUSD on account of the low spread I get.
That's it! Once you have all this set up you are ready to go.
Ideal Targets: Around 5-10 + pips or else when you get to 10 pips, take half the lots off as profit and let the rest run, putting your stop loss at break even, or trail it at the 1 minute or 15 second super-trend stop loss line.
My trading style
I have included 2 pictures to give you an idea how I trade this system. I have used the EURUSD today as there has been a lot of dollar strength and the pair has been in a pretty good downtrend most of the Asian session.
So once I am convinced I have enough volume and momentum for the trending pair I have selected I am then ready to go. This part is very important, on account if the pair you want to trade is choppy showing no prevailing trend, it would be a good idea to look for a pair that is trending, or just waiting the chop out.
Back to the trading. So if you look at the 1 minute chart you will see in the middle of the chart a good pull back from the prevailing trend, it's peak is hit at about 12:50 on the chart.
What I am looking for now is my first trigger, and that happens at about 12:52 on the chart. The super-trend indicator gives a short signal on the 1 minute chart. Once we get that signal we are almost ready to pull the trigger.
Pulling the trigger
Now at this point, pulling the trigger becomes very discretionary, meaning there are a few different ways to enter depending on how aggressive you want to be, as you learn and practice with this system you will see what I mean, and I will share these other entries at a later date if this thread continues.
I have found that the best entry is the following. After you receive intial signal from the 1 minute chart, you now go to the 15 second chart and a wait the same signal. In this example it happens at about 12:58. Your stop loss becomes any time the super-trend line is completely violated by a closing bar. On this trade you can see this happens at about 13:06.
Like I mentioned, there are alternative stop loss areas and trade entries. I will cover these later if there is interest.
Ninja chart indicators ( free of charge )
www.greattradingsystems.com/Ninja Trader Indicators/
The following is what I have on my charts:
EMA (Close, 21)
EMA (Close, 55)
RSqueeze (BBSqueeze)
PBF-Scalper-Show-Me
SMA (Close,200)
SMA (Close, 100)
Bollinger (Close, 2,14)
Super Trend (14,2.618,True)
VolumeZones (Close,10,1, False, 80)
WoodiesCCI (14.6)
QQE (Close, 14,5)
HeikenAshi
Attached Image(s) (click to enlarge)