Hi Sreeprakash,
Interesting set up. Thanks for the post.
Kareem
Ignored
Thank you kareem bhai..
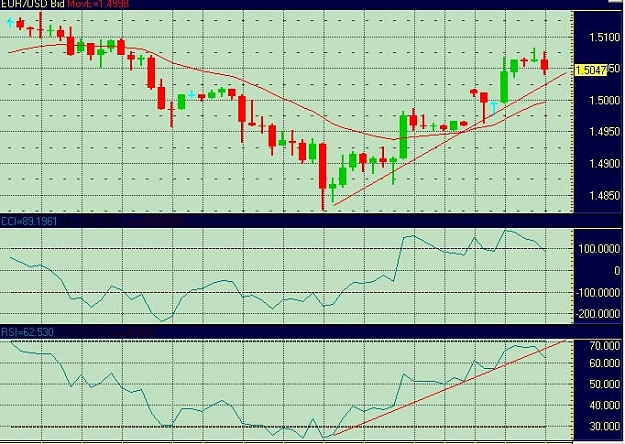
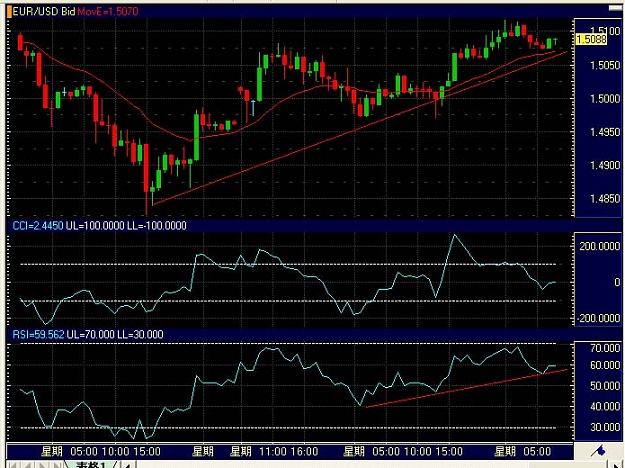
The trendlines in the chart is done by an indicator, attached herewith.
The trendlines in RSI is manually drawn...
I use RSI 14, but after reading this thread, I also attached a 21 RSI and I tryto draw same line on both RSI's....
I also try to match the RSI trendline with chart trendlines...
I also used CCI, but I feel RSI is good...
Indicator note: disable drawing semafor and your chart will be neat..
It came down 42 pips from my target and I was hoping for 6400..
But gbp is today little volatile because of some banks buying gbpusd and selling eurgbp.. also dubai news affecting...
It just hit my entry and again down, but I am not again trading on the above setup...
Thank you kareem bhai..
The trendlines in the chart is done by an indicator, attached herewith.
The trendlines in RSI is manually drawn...
I use RSI 14, but after reading this thread, I also attached a 21 RSI and I tryto draw same line on both RSI's....
I also try to match the RSI trendline with chart trendlines...
I also used CCI, but I feel RSI is good...
Indicator note: disable drawing semafor and your chart will be neat..
Ignored
Thanks for the file and your posts. I will try it later tonight.
Kareem
Does anyone here know how to right a simple expert advisor program? my parameters are simple.
When RSI(5) hits level of 20 I want to put in a buy order for 1 lot and an alarm go off.
I want it to sell the lot when 10 pips are reached.
If the price drops below 20 pips from where the buy was at I want to have the program sell the lot.
The question I would have, is if multiple candlesticks closed below the RSI (5) 20 level consectively would the program buy a lot on each candle (I definitely would not want that to happen)?
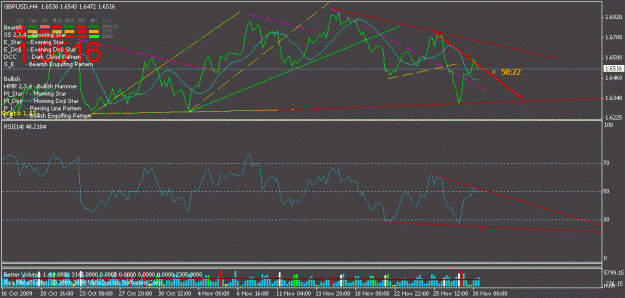
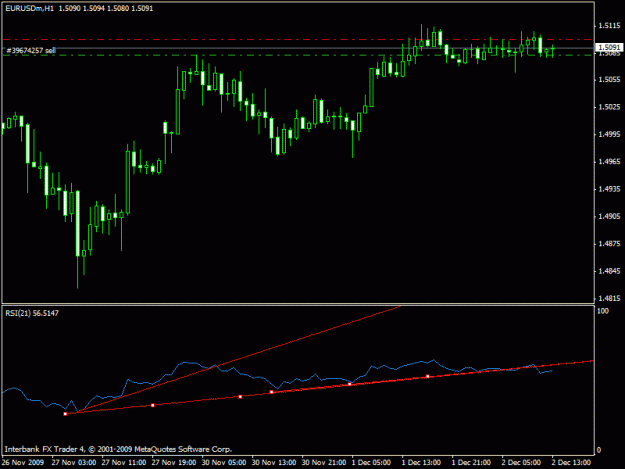
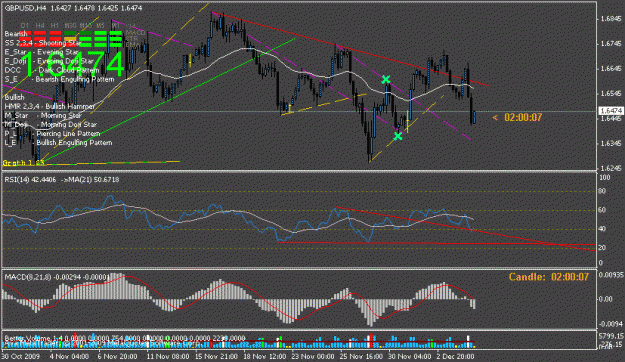
GBPUSD
It did not breaked 6593 level and went down.. At that time I was buying with another setup I felt is good, and I closed with 10 pips profit...
Then I got disconnection and when internet came back I can see this setup..
I sold on 6500, and now running on loss...
Possible targets see trendlines, 6400 (violet line) and 6300 (red line)..
Take care....
Ignored
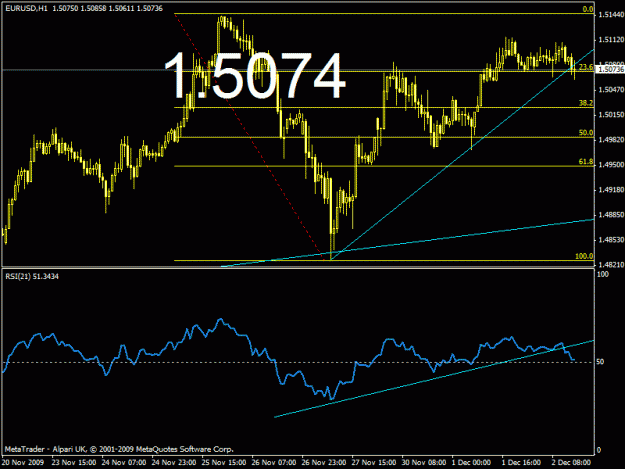
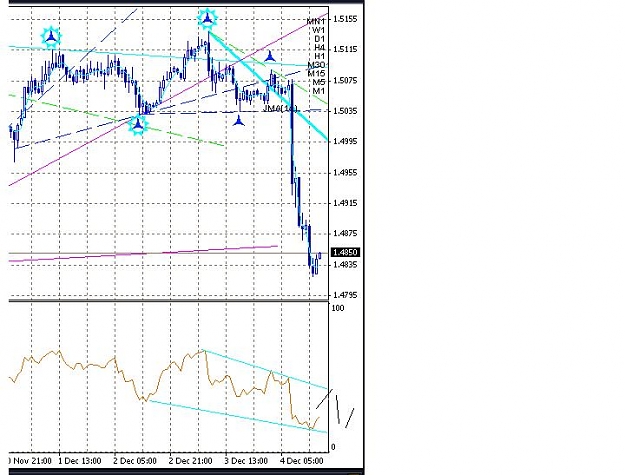
Oh, just seen I did not given update of this trade...
It beautifully went down of 6400, then returned... it was 100 pips trade.. I got out on 40 pips something for some reason...
See the attached picture where price touched and played... (see the green signs)...
Does anyone here know how to right a simple expert advisor program? my parameters are simple.
When RSI(5) hits level of 20 I want to put in a buy order for 1 lot and an alarm go off.
I want it to sell the lot when 10 pips are reached.
If the price drops below 20 pips from where the buy was at I want to have the program sell the lot.
The question I would have, is if multiple candlesticks closed below the RSI (5) 20 level consectively would the program buy a lot on each candle (I definitely would not want that to happen)?
I would...
Ignored
Sorry Livetotrade. I am not a programer. I hope someone else can answer this for you.
Kareem
Oh, just seen I did not given update of this trade...
It beautifully went down of 6400, then returned... it was 100 pips trade.. I got out on 40 pips something for some reason...
See the attached picture where price touched and played... (see the green signs)...
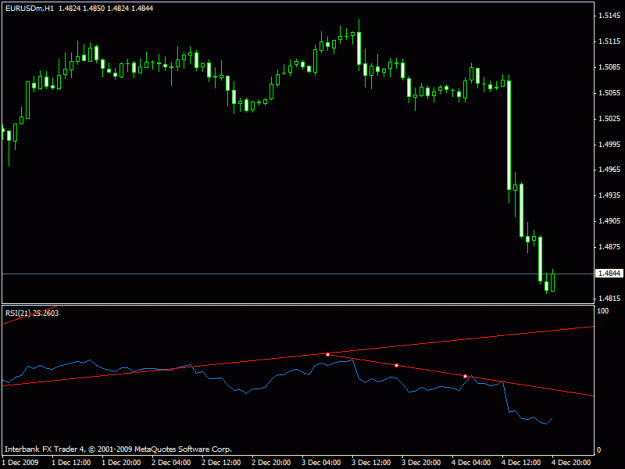
We are a bit over sold for now. My guess is we will hit the line and continue going down
Kareem
Ignored
Thank you kareem bro...
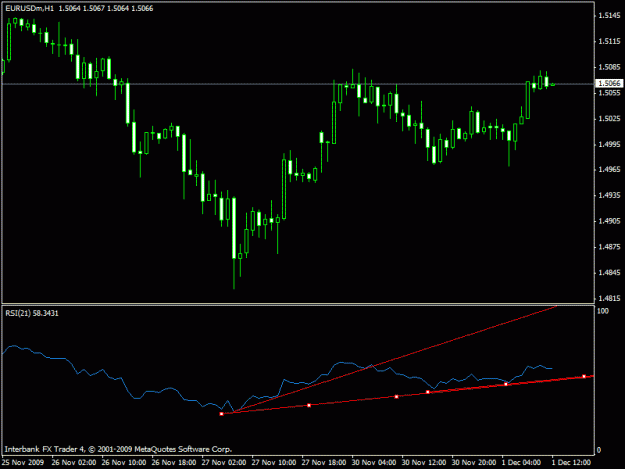
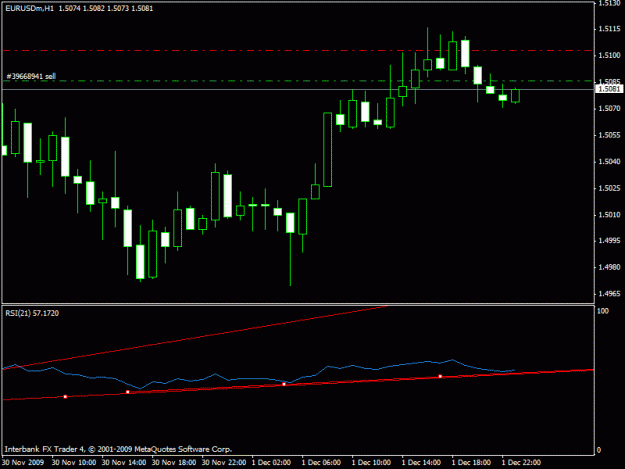
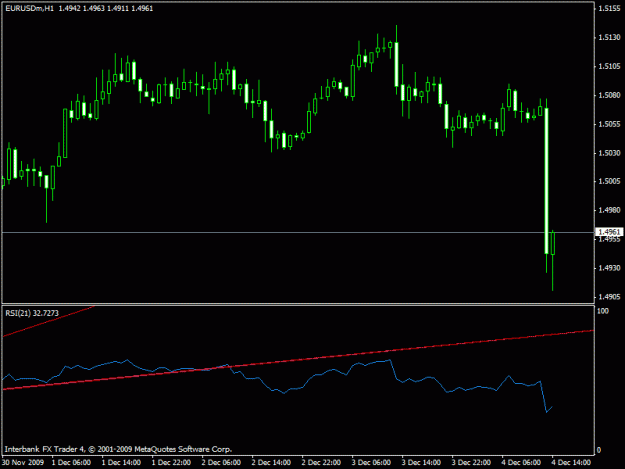
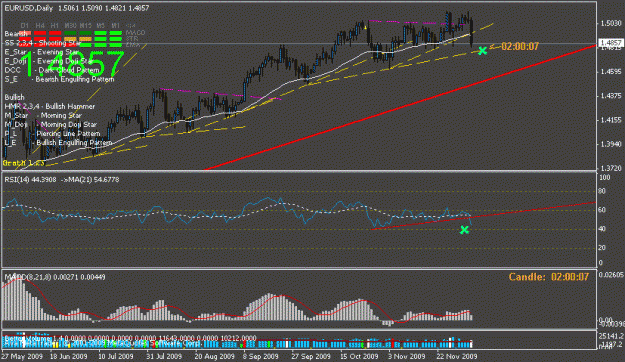
Attached a chart I just posted on GBP thread... (wrong thread actually) http://www.forexfactory.com/showpost...stcount=186104
........................
Here is my analysis...
There is a possibility it can touch the bottom line on 4770.. See the RSI 40 value... If RSI 40 and bottom line 4770 cant bring EU back, then next stop will be 4550 and RSI 20...
But personally, I dont think EU can go more down from current position or from 4770...
...............................
Sorry for quoting from another thread...
Now I have something to ask with kareem bro...
1. I was reading from start of the thread today and around page 30-32 something I read kareem bro said that he is using 4 hour trades because he dont have time... You also said you using big stop loss... I want to know what was the stop losses you used?
2. What is your entry method? I read on a old post that kareem bro using opening of the candle outside.. That means, first RSI trendline will broke, then you wait for current candle to close, then you watch where next candle opens... So if we use trendlines on chart, the candle must be open above for long and below for short???
3. Now if the above is right where is stop loss we place? Or what about the stop loss actually we use? Previous candle high/low??? Or just simply use 20 pips according to 5 minute chart??
I hope you will answer these questions asap...
Plz consider these as a newbie questions...