Hi,
Just to round of the previous post --
Trading should be easy, we should not have to search for our signals - they should be obvious
Using the RSI helps take much of the mystery out of price action
Some of the advantages of using the RSI are:
It offers set support/resistance zones (see earlier posts)- no need to study price charts and make these decisions.
Offers timely signals comparable to that of pure price action (this does not mean that we neglect learning how to read price action)
Very good at picking out divergence with price (great when used in tandem with the CCI(10) - what one may miss, the other picks up
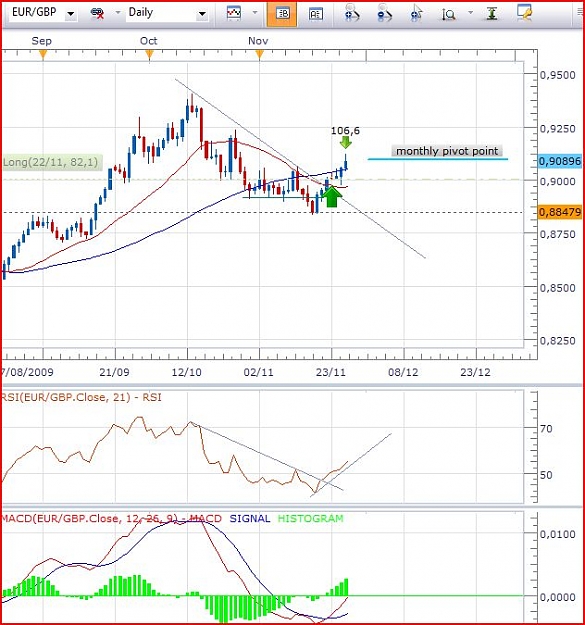
Can be used for line studies. e.g. our trendlines help define trends, or to define patterns.
Etc, etc
Knowing what the various RSI S/R levels represent, we know the possibilities when we have a trendline breach occur at these levels.
Basically trends start from one of two conditions-
Consolidation (congestion), or from a trend reversal (or large retracement/rally)
We know the RSI S/R levels where these occur ssoooooooooo theoretically
THESE ARE THE TRADES WITH THE GREATEST POTENTIAL!!
Before taking a signal - we should look for some form of confirmation i.e. from trend structure (pivot hi/lo sequence), divergence (CCI is very sensitive to this), a price reversal bar etc etc
We construct our trendlines from the RSI pivots as soon as we have 2 lower pivot highs (downtrend), or 2 higher pivot lows (uptrend)
As with everything concerning TA, some are better than others
In constructing our trendlines, only use pivots that form a well defined reversal (V or U)
Discard a pivot whose last "leg" tends to run parallel to the "trendline" that could be drawn by using it
A pivot whose last "leg" crosses the trendline is obviously discarded even though it may conform to the higher hi, higher low or lower high, lower low requirements for an uptrend or downtrend
I think after checking this out against your charts, you will be able to define your potentially best trades
Just take the obvious
Check your charts and make your own rules to suit your requirements.
The above is something to expand upon. If you have never seen something before then you will not recognise it - I.E. you will not see it
The above is the basic bones of a winning system - make it your own - good luck - sorry good TRADING
Peterhttp://cdn.forexfactory.com/images/icons/icon7.gif
PS I use RSI(9) and trade the daily timeframe.
Just to round of the previous post --
Trading should be easy, we should not have to search for our signals - they should be obvious
Using the RSI helps take much of the mystery out of price action
Some of the advantages of using the RSI are:
It offers set support/resistance zones (see earlier posts)- no need to study price charts and make these decisions.
Offers timely signals comparable to that of pure price action (this does not mean that we neglect learning how to read price action)
Very good at picking out divergence with price (great when used in tandem with the CCI(10) - what one may miss, the other picks up
Can be used for line studies. e.g. our trendlines help define trends, or to define patterns.
Etc, etc
Knowing what the various RSI S/R levels represent, we know the possibilities when we have a trendline breach occur at these levels.
Basically trends start from one of two conditions-
Consolidation (congestion), or from a trend reversal (or large retracement/rally)
We know the RSI S/R levels where these occur ssoooooooooo theoretically
THESE ARE THE TRADES WITH THE GREATEST POTENTIAL!!
Before taking a signal - we should look for some form of confirmation i.e. from trend structure (pivot hi/lo sequence), divergence (CCI is very sensitive to this), a price reversal bar etc etc
We construct our trendlines from the RSI pivots as soon as we have 2 lower pivot highs (downtrend), or 2 higher pivot lows (uptrend)
As with everything concerning TA, some are better than others
In constructing our trendlines, only use pivots that form a well defined reversal (V or U)
Discard a pivot whose last "leg" tends to run parallel to the "trendline" that could be drawn by using it
A pivot whose last "leg" crosses the trendline is obviously discarded even though it may conform to the higher hi, higher low or lower high, lower low requirements for an uptrend or downtrend
I think after checking this out against your charts, you will be able to define your potentially best trades
Just take the obvious
Check your charts and make your own rules to suit your requirements.
The above is something to expand upon. If you have never seen something before then you will not recognise it - I.E. you will not see it
The above is the basic bones of a winning system - make it your own - good luck - sorry good TRADING
Peterhttp://cdn.forexfactory.com/images/icons/icon7.gif
PS I use RSI(9) and trade the daily timeframe.