• Home
  • Forums
  • Trades
  • News
  • Calendar
  • Market
  • Brokers
  • Login
  • Join
  • User/Email: Password:
  • 1:23am
Menu
  • Forums
  • Trades
  • News
  • Calendar
  • Market
  • Brokers
  • Login
  • Join
  • 1:23am
Sister Sites
  • Metals Mine
  • Energy EXCH
  • Crypto Craft

Options

Bookmark Thread

First Page First Unread Last Page Last Post

Print Thread

Similar Threads

Volume Spread Analysis (VSA) and background 5 replies

Trading With VSA - Volatile Volume and Spread Analysis 9 replies

What is the best VSA (Volume Spread Analysis) system/indicator? 1 reply

Volume Spread Analysis (VSA) and the EURUSD 3 replies

VSA Volume Spread Analysis: No demand and accumlation 2 replies

  • Commercial Content
  • /
  • Reply to Thread
  • Subscribe
  • 2,519
Attachments: Trade Using VSA (Volume Spread Analysis)
Exit Attachments

Trade Using VSA (Volume Spread Analysis)

  • Last Post
  •  
  • 1 207208Page 209210211 445
  • 1 Page 209 445
  •  
  • Post #4,161
  • Quote
  • Edited at 6:11am Nov 22, 2009 5:42am | Edited at 6:11am
  •  mima
  • | Membership Revoked | Joined May 2008 | 3,395 Posts
hello Shamus

I want to ask you and everyone else who is skilled in programming to convert BetterVolume 1.4 and BetterVolume ChartBars part1 1.4 and BetterVolume ChartBars part2 1.4 and CDRW and BetterVolume_CDRW_Alert(created by bbartha) into .mql5 format for MT5... Unfortunately thatwasme and bbartha are not longer with us on this thread so I am asking those of you who knows to programm.

Thank you and evryone else willing to help.

Best Regards
The Market pays you to be disciplined
 
 
  • Post #4,162
  • Quote
  • Nov 22, 2009 1:24pm Nov 22, 2009 1:24pm
  •  taomql4
  • Joined Dec 2008 | Status: Resident Psychiatrist!!! | 2,599 Posts
Quoting mima
Disliked
hello Shamus

I want to ask you and everyone else who is skilled in programming to convert BetterVolume 1.4 and BetterVolume ChartBars part1 1.4 and BetterVolume ChartBars part2 1.4 and CDRW and BetterVolume_CDRW_Alert(created by bbartha) into .mql5 format for MT5... Unfortunately thatwasme and bbartha are not longer with us on this thread so I am asking those of you who knows to programm.

Thank you and evryone else willing to help.

Best Regards
Ignored
You could try the link , haven't had the
time to try it out yet..something about Rewrite mt4script
to mt5..

http://metatrader5.blogspot.com/
 
 
  • Post #4,163
  • Quote
  • Nov 22, 2009 2:17pm Nov 22, 2009 2:17pm
  •  mima
  • | Membership Revoked | Joined May 2008 | 3,395 Posts
Quoting taomql4
Disliked
You could try the link , haven't had the
time to try it out yet..something about Rewrite mt4script
to mt5..

http://metatrader5.blogspot.com/
Ignored
Thank you very much...I will try....It does not convert 100% ...Still hopping some experienced programmers will come up with converted indicators...
Everyone will need these indicators in some point of time...
The Market pays you to be disciplined
 
 
  • Post #4,164
  • Quote
  • Nov 22, 2009 2:57pm Nov 22, 2009 2:57pm
  •  giraia_br
  • Joined Jun 2007 | Status: Member | 1,124 Posts
Quoting mima
Disliked
hello Shamus

I want to ask you and everyone else who is skilled in programming to convert BetterVolume 1.4 and BetterVolume ChartBars part1 1.4 and BetterVolume ChartBars part2 1.4 and CDRW and BetterVolume_CDRW_Alert(created by bbartha) into .mql5 format for MT5... Unfortunately thatwasme and bbartha are not longer with us on this thread so I am asking those of you who knows to programm.

Thank you and evryone else willing to help.

Best Regards
Ignored
where are these indicators? All i found was the Better Volume 1.4.


and what these indicators doo?

i want something so simple: sound alert when there are buying and selling climax.


thanks in advance.
 
 
  • Post #4,165
  • Quote
  • Edited at 4:12pm Nov 22, 2009 3:05pm | Edited at 4:12pm
  •  mima
  • | Membership Revoked | Joined May 2008 | 3,395 Posts
Quoting giraia_br
Disliked
where are these indicators? All i found was the Better Volume 1.4.


and what these indicators doo?

i want something so simple: sound alert when there are buying and selling climax.


thanks in advance.
Ignored
indicators are in this thread...if you found that one you will find others too.
The Market pays you to be disciplined
 
 
  • Post #4,166
  • Quote
  • Nov 22, 2009 4:39pm Nov 22, 2009 4:39pm
  •  egkid
  • Joined Apr 2008 | Status: Member | 9,414 Posts
Quoting tfflyer
Disliked
EGkind, nothing personal,
but i am not sure You understand what means VSA.

Best,
Tom
Ignored
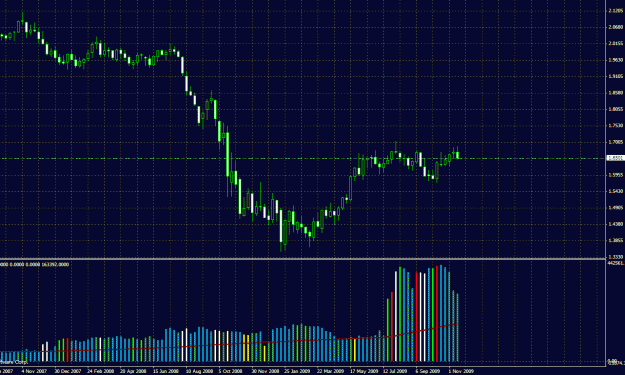
Can you tell what do you read from this weekly chart G/U,Where are we going?
Attached Image (click to enlarge)
Click to Enlarge

Name: tt.gif
Size: 34 KB
 
 
  • Post #4,167
  • Quote
  • Nov 22, 2009 5:27pm Nov 22, 2009 5:27pm
  •  tfflyer
  • | Joined Sep 2007 | Status: Member | 1,404 Posts
I can tell You - It can go Up and Down.

What You want to hear ?


If i will tell You its going Up and it will go up 100 pips and then .... price will go down 500 pips - i will be wrong that i said its going UP ?


Or..

If i will tell You it is going to go down 100 pips and then ... price will shooot up 500 pips - will i be right when i said its going down ?


Or...

Price will go just 50 pips up, when i said - Its going for sure UP.. It can affect me on my trading a lot..and i will hold my LONG trade .. just to show to public i was right ?
No, i will change my order fast..
But what will public think ? Tom was wrong..

But did public knows that i already changed my order when it only went 35 pips UP ? No.. public will not know it... etc etce etc...

I am sure, someone will understand me what i mean in my story here ..


Neverending story for those who asks such questions like You.

As some members have said, my mind is changing as fast as money flow and i am not so fast in psoting posts in forum, so , perhaps, i will be always wrong in public eyes, when in reality i will change my orders fast..


Neverending story for those who asks such question as You.


Nothing personal, really..


I just think to ask such question as You asked... - I need and You too to wright down A LOT OF IF... IF.... IF... AND.. IF IF IF IF IF..... etc...


I am sure i didnt answered Your question.

But what i said in first post to You - i havent changed my mind

Have a great trading week !

Best,
Tom

Quoting egkid
Disliked
Can you tell what do you read from this weekly chart G/U,Where are we going?
Ignored
 
 
  • Post #4,168
  • Quote
  • Nov 22, 2009 5:56pm Nov 22, 2009 5:56pm
  •  egkid
  • Joined Apr 2008 | Status: Member | 9,414 Posts
Quoting tfflyer
Disliked
I can tell You - It can go Up and Down.

What You want to hear ?


If i will tell You its going Up and it will go up 100 pips and then .... price will go down 500 pips - i will be wrong that i said its going UP ?


Or..

If i will tell You it is going to go down 100 pips and then ... price will shooot up 500 pips - will i be right when i said its going down ?


Or...

[b]Price will go just 50 pips up, when i said - Its going for sure UP.. It can affect me on my trading a lot..and i will hold my LONG...
Ignored
Oh man
First I'm bigger than to be not happy because what you thought if i understand or not this Tech.
My main concern to ask that question to LEARN And to know my weaken point i missed!! But you didn't answer my question.

By my tools i see it going down on my previous chart i post which is weekly.
I was thinking to post my weekly chart with my tools and explain but you didn't answer me , so....
Happy trading Bro
 
 
  • Post #4,169
  • Quote
  • Nov 22, 2009 6:53pm Nov 22, 2009 6:53pm
  •  HiddenGap
  • Joined Aug 2009 | Status: Reading the tape | 2,299 Posts
Quoting egkid
Disliked
Can you tell what do you read from this weekly chart G/U,Where are we going?
Ignored
There is no point in trying to predict the market. The future is unknown and not knowable. The better question to be asking (yourself) is, "What do I need to see to get either long or short?" Once you can answer that the question becomes, "Where do I need to see it?"

I don't trade off a weekly chart, nor do I trade cable. I have taken a quick look at the chart and it is pretty interesting.

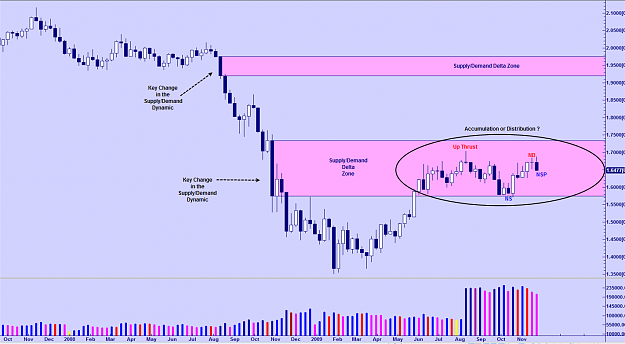
From a non vsa point of view, I am first struck by where price is now and what it is doing within this area. It looks to be consolidating in an area where there previously was a key change in the supply/demand dynamic. Another word or words for this consolidation would be accumulation or distribution. We can see both up candles and down candles on volume less than the previous two candles. This is typical during this type of market phase.

THE BULLISH CASE:
Notice the NS (no supply) candle at the bottom of the WRB zone. While the volume is less than the previous two, it is a bit high. If we skip all the way to the last candle, we see a down candle closing near its low on volume less than the previous two candles. This is No Selling Pressure. Note that the volume not only less than the previous two candles but also less than the aforementioned no supply candle. IF the market is bullish, we want to see a down candle on volume less than the previous two candles that closes on or near its high. This would be a test.

THE BEARISH CASE:
Notice there is an Up Thrust in the background as price made a move up. The high of this Up Thrust is a lower high. If the market is making lower highs, it can't be in an up trend. The Second to last candle is an up candle closing in the middle on volume less than the previous two candles-No Demand. So we have No Demand following an Up Thrust and the up candle, which is the No Demand is failing to make a higher high than the Up Thrust. The next candle confirms the no demand but volume drops off. IF the market is bearish, we could see a down candle on increasing volume. After which we would be looking for an up candle on low volume (another no demand). Or we could see a failed test. This test would have High volume telling us that there is supply underneath the market which would be bearish.

As this is a U.S. Holiday shortened week, we have to be careful. Again, no prediction here, just some things you ought to be looking for in the price action. Rather than focusing on what price might or should do, focus on what price is doing. Ultimately, the market is building a cause for its next move whichever way that may be.
Attached Image (click to enlarge)
Click to Enlarge

Name: ex1.png
Size: 135 KB
Wyckoff VSA: (1) Supply v Demand (2) Effort v Result (3) Cause v Effect
 
 
  • Post #4,170
  • Quote
  • Nov 23, 2009 5:11am Nov 23, 2009 5:11am
  •  tfflyer
  • | Joined Sep 2007 | Status: Member | 1,404 Posts
Hello HG,

after ND there is down bar and You marked it as NS bar.

But, isnt it result ( down bar ) versus effort ( ND ) ?

Or, ND is valid ONLY if there is down bar with INCREASE volume?

Thank You.


Best,
Tom


Quoting HiddenGap
Disliked
There is no point in trying to predict the market. The future is unknown and not knowable. The better question to be asking (yourself) is, "What do I need to see to get either long or short?" Once you can answer that the question becomes, "Where do I need to see it?"

I don't trade off a weekly chart, nor do I trade cable. I have taken a quick look at the chart and it is pretty interesting.

From a non vsa point of view, I am first struck by where price is now and what it is doing within this area. It looks to be consolidating in an area where...
Ignored
 
 
  • Post #4,171
  • Quote
  • Edited at 10:46am Nov 23, 2009 10:13am | Edited at 10:46am
  •  tfflyer
  • | Joined Sep 2007 | Status: Member | 1,404 Posts
Hi everyone,

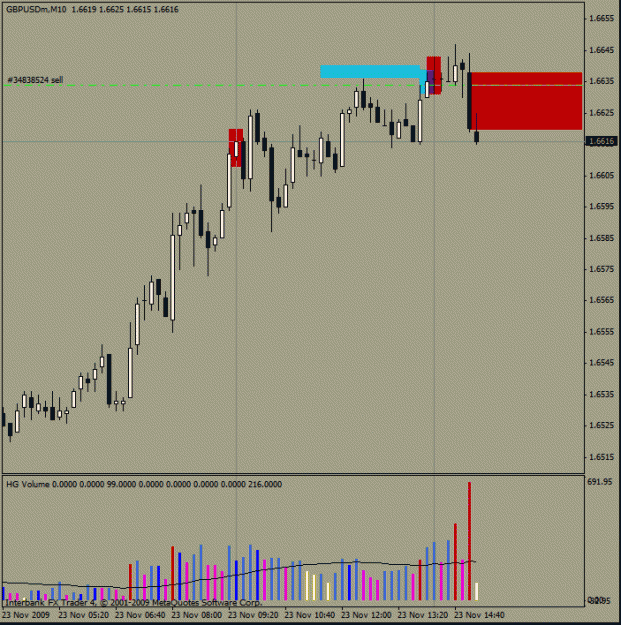
I will be looking for shorts in BIGGEST red box..

SL above HIGHS + will look for volume etc...

p.s.
I have already 1 short.


EDIT 1:

Not looking for shorts no more. Trailing my existing short.
Picture 2 - Black line means SL for this short.


EDIT 2:

SL penetrated.


EDIT 3:

I decided to still look for shorts in biggest red BOX.


Best,
Tom
Attached Images (click to enlarge)
Click to Enlarge

Name: gu short.gif
Size: 18 KB Click to Enlarge

Name: gu short trail.gif
Size: 21 KB Click to Enlarge

Name: 3.gif
Size: 20 KB
 
 
  • Post #4,172
  • Quote
  • Nov 24, 2009 3:55am Nov 24, 2009 3:55am
  •  HiddenGap
  • Joined Aug 2009 | Status: Reading the tape | 2,299 Posts
Quoting tfflyer
Disliked
Hello HG,

after ND there is down bar and You marked it as NS bar.

But, isnt it result ( down bar ) versus effort ( ND ) ?

Or, ND is valid ONLY if there is down bar with INCREASE volume?

Thank You.


Best,
Tom
Ignored
No Demand (ND) is defined as a narrow range up candle/bar with volume less than the previous two candles/bars. It is confirmed if and only if the next bar is down.

But let's back up for a second. What does the low volume (less than the previous two ) tell us? It tells us that the SM is neither active nor interested in the movement on that interval. In other words, the candle/bar is going up but the BBs are not participating in the movement.

So if the next candle/bar which confirms the No Demand has even less volume than the No Demand itself, doesn't that mean that the BBs are even less active and interested than they were on the prior candle/bar?

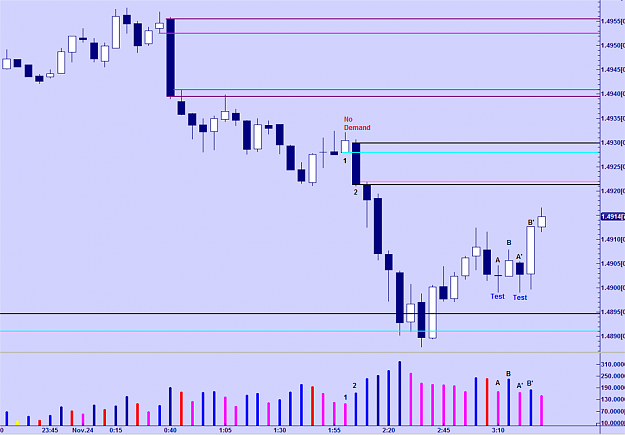
Take a look at the chart below.

#1 is a classic No demand. it is a narrow (NR4) range up candle on volume less than the previous two candles closing off its highs.

#2 confirms that #1 is No Demand as it closes lower. But look at the volume. Along with the range, it has increased. This tells us that while the BBs were not active on the previous candle, they are more active here. This would of course make sense. They were not interested in higher prices because they knew the market was weak. Once they see an up candle on low volume they are sure that path of least resistance is down. We would expect volume to increase (effort) in the direction of the path of least resistance.

The opposite is true of a test.

A. is a very nice example of a test. The following candle confirms the test candle and has increasing volume. Again, if a test is "good" then volume would be low. This shows little supply underneath the market. It also shows little professional activity as the price is marked down. On the next candle we want to see that professional activity return in the form of increased volume.

A' and B' are yet another example.
Attached Image (click to enlarge)
Click to Enlarge

Name: ex2.png
Size: 79 KB
Wyckoff VSA: (1) Supply v Demand (2) Effort v Result (3) Cause v Effect
 
 
  • Post #4,173
  • Quote
  • Nov 24, 2009 4:22am Nov 24, 2009 4:22am
  •  TC East
  • | Joined Jun 2007 | Status: "I reach!" | 594 Posts
Quoting HiddenGap
Disliked
No Demand (ND) is defined as a narrow range up candle/bar with volume less than the previous two candles/bars. It is confirmed if and only if the next bar is down.

But let's back up for a second. What does the low volume (less than the previous two ) tell us? It tells us that the SM is neither active nor interested in the movement on that interval. In other words, the candle/bar is going up but the BBs are not participating in the movement.

So if the next candle/bar which confirms the No Demand has even less volume than the No Demand itself,...
Ignored
Great stuff! Very clear and easy to understand...thanks
 
 
  • Post #4,174
  • Quote
  • Nov 24, 2009 4:57am Nov 24, 2009 4:57am
  •  tfflyer
  • | Joined Sep 2007 | Status: Member | 1,404 Posts
Thanks HG for explanation.

Best,
Tom

Quoting HiddenGap
Disliked
No Demand (ND) is defined as a narrow range up candle/bar with volume less than the previous two candles/bars. It is confirmed if and only if the next bar is down.

But let's back up for a second. What does the low volume (less than the previous two ) tell us? It tells us that the SM is neither active nor interested in the movement on that interval. In other words, the candle/bar is going up but the BBs are not participating in the movement.

So if the next candle/bar which confirms the No Demand has even less volume than the No Demand itself,...
Ignored
 
 
  • Post #4,175
  • Quote
  • Nov 24, 2009 6:41pm Nov 24, 2009 6:41pm
  •  denverdude
  • | Joined Apr 2008 | Status: Member | 198 Posts
Quoting HiddenGap
Disliked
No Demand (ND) is defined as a narrow range up candle/bar with volume less than the previous two candles/bars. It is confirmed if and only if the next bar is down.

But let's back up for a second. What does the low volume (less than the previous two ) tell us? It tells us that the SM is neither active nor interested in the movement on that interval. In other words, the candle/bar is going up but the BBs are not participating in the movement.

So if the next candle/bar which confirms the No Demand has even less volume than the No Demand itself,...
Ignored
HG,
As always, thanks for your detailed explanation.

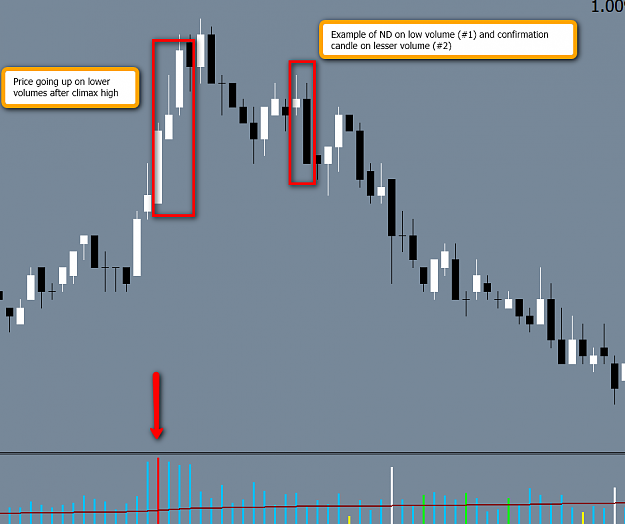
I thought this chart might help with the low volume ND and even lesser volume confirmation candle.

Today's $CHF M5 chart.
Attached Image (click to enlarge)
Click to Enlarge

Name: usdchf112409.png
Size: 53 KB
 
 
  • Post #4,176
  • Quote
  • Edited at 7:12pm Nov 24, 2009 6:59pm | Edited at 7:12pm
  •  HiddenGap
  • Joined Aug 2009 | Status: Reading the tape | 2,299 Posts
Quoting denverdude
Disliked
HG,
As always, thanks for your detailed explanation.

I thought this chart might help with the low volume ND and even lesser volume confirmation candle.

Today's $CHF M5 chart.
Ignored
Thanks Denver. I have a couple of issues with your pic, however:

1. No Demand should be on a narrow range candle. It can be equal in range to the previous but it is prefered that it is narrower. When the range is increasing, it is not no demand.

2. As I look at the volume, I fail to see two consecutive candles where both have volume less than the previous two. No demand has volume less than the previous two candles. For the next candle to have less volume it too must have volume less than the previous two candles.

With that said, it is true that a no demand can be followed by a down candle on even less volume and the market can still go down. But look at the picture of cable that started this discussion and then look at a current chart. Cable is up. Why? Well, I don't know why. But I do know that the no demand was followed by a down candle with even less volume.

If volume is activity, then the SM was less active AFTER the no demand than on it. That can't be good if you are looking for prices to fall......

BTW, the left side only proves my point. Prices did rise on decreasing volume but the move was suspect. That's why price was near a top. If that move was to be trusted, we would want volume to increase in the direction of the move- up candles on increasing volume.

Let's go back to MTM:

Bullish volume is increasing volume on up bars. Or decreasing volume on down bars.

Bearish volume is increasing volume on down bars. Or decreasing volume on up bars.
Wyckoff VSA: (1) Supply v Demand (2) Effort v Result (3) Cause v Effect
 
 
  • Post #4,177
  • Quote
  • Edited at 9:19am Nov 25, 2009 8:50am | Edited at 9:19am
  •  tfflyer
  • | Joined Sep 2007 | Status: Member | 1,404 Posts
Hello everyone,

comments from expierenced traders would be the best for this, if possible.


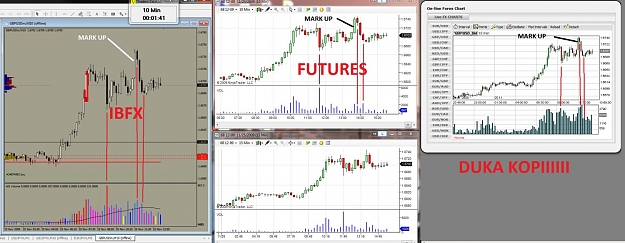
Here is 3 data feed providers.

All of them showed 1 thing - Wide spread down bar with HIGH volume with no folowing to down. .

After MARK UP on volume less than down bar, there was folowing down bar.

Only futures showed not to go out of trade ( atleast for me ), because i didnt saw any sign of END OF RISING MARKET.

If i hadnt look on futures, i would go out on downbar, which is after MARK UP.

Third downbar on FUTURES platforms showed information - Quite Nr range bar on high vol and that told me - stay in more.

IBFX and DUKAS KOPII - they showed different thing - lack of supply , WHEN FUTURES SHOWED -> stay in long trade.

Edit + :

Next downbar on Futures after mark up showed me - yes, there is some supply, but not so much to bring all the way down. Because downbar from my interpretation was on high volume not ultra high.
Offcourse.. perhaps - its enough to take down g/u, but i just yet dont know it...


BUT THIS IS MY INTERPRETATION.. ATLEAST ON THIS MY LEARNING STAGE.


I tried not to wright all the things, as i know - not all is interested to read a lot of txt

Any comments are welcome.

Thank You.


Best,
Tom
Attached Image (click to enlarge)
Click to Enlarge

Name: GU.jpg
Size: 131 KB
 
 
  • Post #4,178
  • Quote
  • Nov 25, 2009 9:55am Nov 25, 2009 9:55am
  •  denbur
  • | Joined Sep 2008 | Status: Member | 96 Posts
tfflyer,

how about this reading:
the ease of movement on the down side after mark up is better then on the up side, imho. the bar that you identified as "lack of supply" in my opinion means two things: 1st - lack of stopping volume, which is bearish after supply was present. 2nd - the ease of movement on the down side tells me that too much people want to get out before the news. someone had to reduce selling at support just to allow to distribute it slowly otherwise the market became too thin. market comes back up, distribution comes in; as market goes lower, they reduced selling, then market back up, distribution come back again.

sorry no charts

Quoting tfflyer
Disliked
Hello everyone,

comments from expierenced traders would be the best for this, if possible.


Here is 3 data feed providers.

All of them showed 1 thing - Wide spread down bar with HIGH volume with no folowing to down. .

After MARK UP on volume less than down bar, there was folowing down bar.

Only futures showed not to go out of trade ( atleast for me ), because i didnt saw any sign of END OF RISING MARKET.

If i hadnt look on futures, i would go out on downbar, which is after MARK UP.

Third downbar on FUTURES platforms showed...
Ignored
 
 
  • Post #4,179
  • Quote
  • Nov 25, 2009 10:03am Nov 25, 2009 10:03am
  •  tfflyer
  • | Joined Sep 2007 | Status: Member | 1,404 Posts
Thank You Denbur for Your comments !

As always - they are very informative.

EDITED:

Den, You are talking about Distribution. What is signs of Distribution what You see on GU ? Thanks.

Best,
Tom


Quoting denbur
Disliked
tfflyer,

how about this reading:
the ease of movement on the down side after mark up is better then on the up side, imho. the bar that you identified as "lack of supply" in my opinion means two things: 1st - lack of stopping volume, which is bearish after supply was present. 2nd - the ease of movement on the down side tells me that too much people want to get out before the news. someone had to reduce selling at support just to allow to distribute it slowly otherwise the market became too thin. market comes back up, distribution comes in; as...
Ignored
 
 
  • Post #4,180
  • Quote
  • Nov 25, 2009 11:26am Nov 25, 2009 11:26am
  •  s21
  • | Joined Jul 2009 | Status: Member | 81 Posts
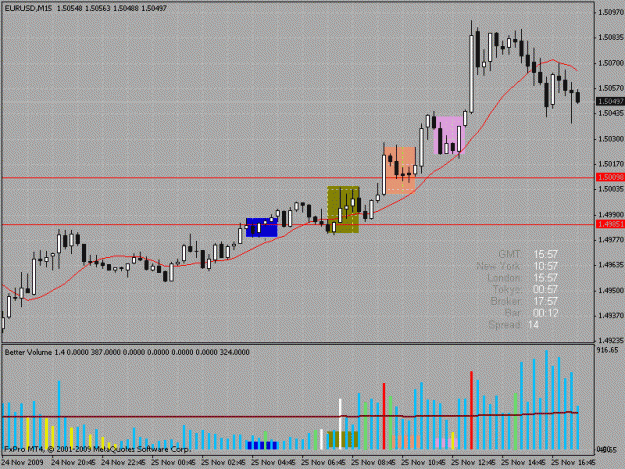
hi, can you please help me find which of the follow situations provide a good entry in eur/usd, 15 min chart. i did'nt find a valid entry and i'm curious about your opinion.

blue square it's first attempt to break the resistance; high vol/narrow spread and next candles make higher highs at narrow spread/lower vol => no demand;
olive square it's the second attempt we have a buying climax( i think...) but the next candle who suppose to confirm had very high vol wich made me worry..
orange square it's the attempt to break the second resistance and it does at higher vol and after the down candles are on lower vol which shows the retracement and i was all most ready to entry but the confirmation candle closed on lower half on higher vol which make me wait again;
plum square shows again down candles with lower vol which makes'it a retracement and we have a no supply followed by a high vol up candle which i think it was the best moment to entry but i felled asleep ...
thanks, sorin.(if my english is bad sorry, is not my primary language)
Attached Image (click to enlarge)
Click to Enlarge

Name: s.gif
Size: 23 KB
"Imagination is more important than knowledge" Einstein
 
 
  • Commercial Content
  • /
  • Trade Using VSA (Volume Spread Analysis)
  • Reply to Thread
    • 1 207208Page 209210211 445
    • 1 Page 209 445
0 traders viewing now
  • More
Top of Page
  • Facebook
  • Twitter
About FF
  • Mission
  • Products
  • User Guide
  • Media Kit
  • Blog
  • Contact
FF Products
  • Forums
  • Trades
  • Calendar
  • News
  • Market
  • Brokers
  • Trade Explorer
FF Website
  • Homepage
  • Search
  • Members
  • Report a Bug
Follow FF
  • Facebook
  • Twitter

FF Sister Sites:

  • Metals Mine
  • Energy EXCH
  • Crypto Craft

Forex Factory® is a brand of Fair Economy, Inc.

Terms of Service / ©2022