• Home
  • Forums
  • Trades
  • News
  • Calendar
  • Market
  • Brokers
  • Login
  • Join
  • User/Email: Password:
  • 1:03pm
Menu
  • Forums
  • Trades
  • News
  • Calendar
  • Market
  • Brokers
  • Login
  • Join
  • 1:03pm
Sister Sites
  • Metals Mine
  • Energy EXCH
  • Crypto Craft

Options

Bookmark Thread

First Page First Unread Last Page Last Post

Print Thread

Similar Threads

DeMark Indicators (ADVANCED) 311 replies

modify Mouteki/ Demark _trend _new indicator? 62 replies

DeMark TDF Trading 287 replies

Mouteki/Demark Trendlines 18 replies

Anyone following Tom DeMark's methods? 2 replies

  • Trading Systems
  • /
  • Reply to Thread
  • Subscribe
  • 616
Attachments: DeMark TDST Trading
Exit Attachments
Tags: DeMark TDST Trading
Cancel

DeMark TDST Trading

  • Last Post
  •  
  • Page 1 23456 27
  • Page 1 234 27
  •  
  • Post #1
  • Quote
  • First Post: Edited Dec 31, 2009 5:33am Nov 17, 2009 3:30pm | Edited Dec 31, 2009 5:33am
  •  foggyTrader
  • | Joined Jan 2006 | Status: Always look at both scenarios | 640 Posts
Hello Everyone,

The reason I am starting this thread is because I thought it was about time we had a serious Demark trading thread. I have noticed several threads using the Demark method however to my surprise they have never taken off. The DeMark method offers opportunities on any timeframe or pair and can give risk as low as 12 pips for GBPUSD as was the case today on the 5 minute chart.

Going on past experiences I have found that using DeMark TDST setups works best when you have a longer-term view. For example, let say there was a daily bullish thrust on GBPUSD, the following day you would look to buy on a failure of a TDST support levels formed on a lower timeframe. I will try to also post my longer-term views and when I am looking for certain situations to develop. Please feel free to do the same.

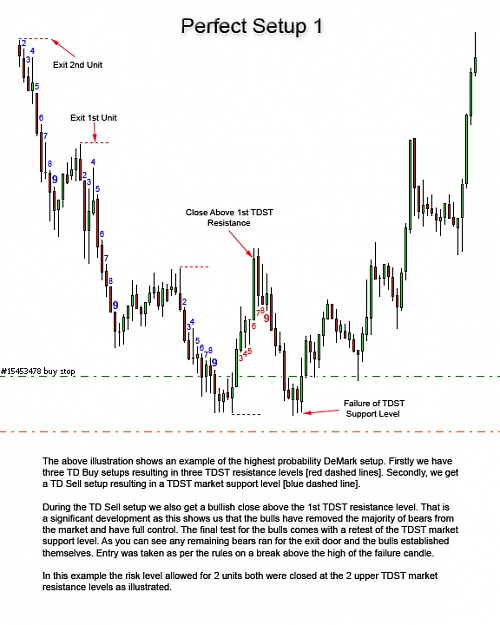
Below is the rules on how I trade the DeMark Method, please just flip all of the below for a buy situation:


TDST Bounce Sell Conditions

Step One:
The formation of a 9 count downtrend exhaustion sequence and TDST resistance level

Step Two:

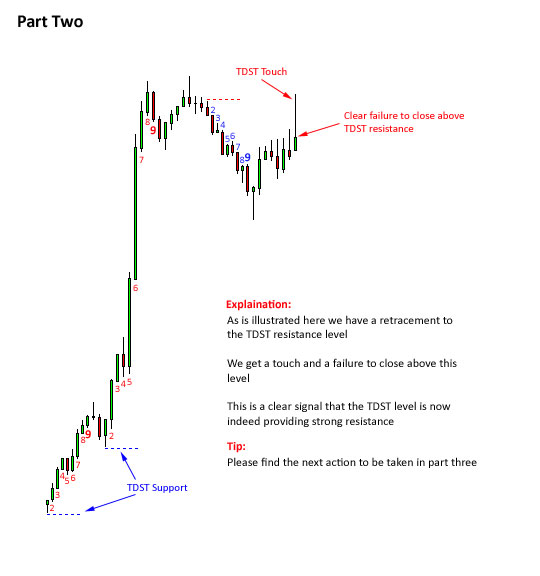
A retracement, touch and failure at the TDST resistance level*

Step Three:

Upon the closure of TDST resistance touch candle the chart will display the recommended number of lots

Step Four:

Press ctrl + S accordingly to open the number of lots specified**

Step Five:

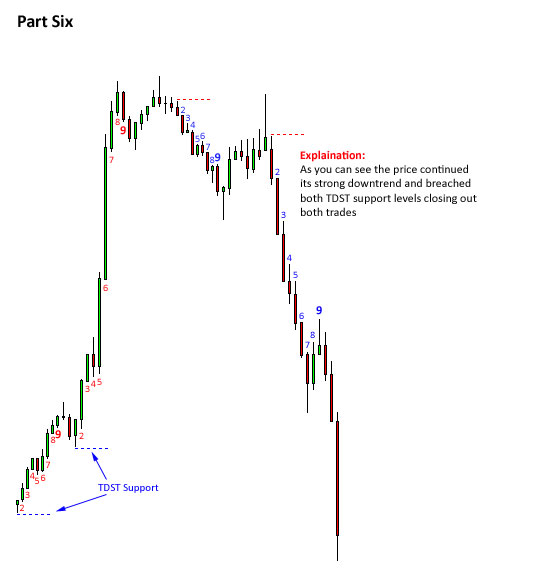
a)Initial target should be placed at the closest TDST support level
b)If there is the formation of a 9 count downtrend exhaustion sequence the stoploss should be moved to the high of the 9th bar.

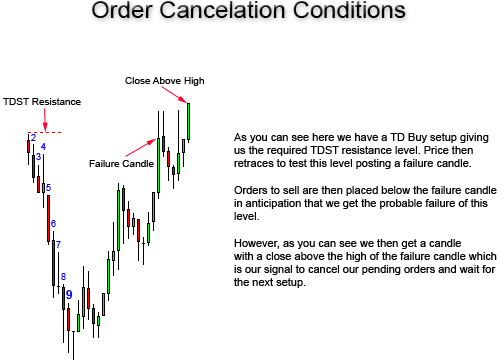
*Please note, once the touch candle has been established and orders have been placed they should only be cancelled if we get a close above the high of the touch candles high. Trades can be cancelled by using the TDCOUNT cancel script

**Please note, by pressing ctrl + S (you set the hotkey to whatever) the script will automatically calculate the entry and stoploss and open 0.1 lots per time and you will be shown how many lots you can risk on the right hand side of the chart. So you can just repeat until the desired number of lots have been placed


I have attached the indicators, scripts and my template file along with a picture of the perfect set-up and an order cancelation situation. In the next post I will post some more scenarios to help people understand it a bit more.

Please feel free to ask any questions, I am here to help.


Cheers
Foggytrader
Attached Image (click to enlarge)
Click to Enlarge

Name: Perfect Set-up 1.jpg
Size: 205 KB

Attached Image
Attached File(s)
File Type: ex4 Tick Value.ex4   2 KB | 1,922 downloads
File Type: zip scripts.zip   11 KB | 1,943 downloads
File Type: tpl td count.tpl   223 KB | 2,524 downloads
File Type: zip Examples.zip   549 KB | 2,582 downloads | Uploaded Nov 20, 2009 7:25am
File Type: ex4 TDcount.ex4   24 KB | 2,127 downloads | Uploaded Dec 31, 2009 5:33am
  • Post #2
  • Quote
  • Nov 17, 2009 3:34pm Nov 17, 2009 3:34pm
  •  foggyTrader
  • | Joined Jan 2006 | Status: Always look at both scenarios | 640 Posts
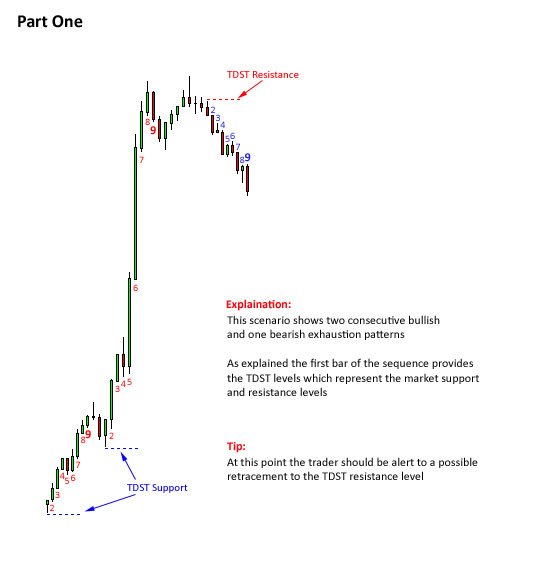
Below is a step by step guide on a buy setup:

Attached Image (click to enlarge)
Click to Enlarge

Name: Trade-1---Part-1.jpg
Size: 62 KB

Attached Image (click to enlarge)
Click to Enlarge

Name: Trade-1---Part-2.jpg
Size: 73 KB

Attached Image (click to enlarge)
Click to Enlarge

Name: Trade-1---Part-3.jpg
Size: 71 KB

Attached Image (click to enlarge)
Click to Enlarge

Name: Trade-1---Part-4.jpg
Size: 77 KB

Attached Image (click to enlarge)
Click to Enlarge

Name: Trade-1---Part-5.jpg
Size: 107 KB

Attached Image (click to enlarge)
Click to Enlarge

Name: Trade-1---Part-6.jpg
Size: 92 KB


Cheers

Foggytrader
 
 
  • Post #3
  • Quote
  • Nov 17, 2009 3:46pm Nov 17, 2009 3:46pm
  •  Petar_Serbia
  • | Commercial Member | Joined May 2009 | 5,750 Posts
Wish you all best and good thread i dont know much about Demark but i will learn on this thread....I always learn something about Forex...
"Buy on fear, sell on greed !!!
 
 
  • Post #4
  • Quote
  • Nov 17, 2009 3:48pm Nov 17, 2009 3:48pm
  •  foggyTrader
  • | Joined Jan 2006 | Status: Always look at both scenarios | 640 Posts
Below is a step by step guide to a sell setup:

Attached Image

Attached Image

Attached Image

Attached Image

Attached Image

Attached Image


Cheers

Foggytrader
 
 
  • Post #5
  • Quote
  • Nov 17, 2009 3:51pm Nov 17, 2009 3:51pm
  •  foggyTrader
  • | Joined Jan 2006 | Status: Always look at both scenarios | 640 Posts
Quoting Petar_Serbia
Disliked
Wish you all best and good thread i dont know much about Demark but i will learn on this thread....I always learn something about Forex...
Ignored
Thanks Petar, hopefully lots of people will get involved!

Cheers
Foggytrader
 
 
  • Post #6
  • Quote
  • Nov 17, 2009 4:04pm Nov 17, 2009 4:04pm
  •  cuddlebum
  • | Joined Feb 2008 | Status: Member | 114 Posts
Quoting foggyTrader
Disliked
Hello Everyone,...
Ignored
What does TDST stand for?
 
 
  • Post #7
  • Quote
  • Nov 17, 2009 4:40pm Nov 17, 2009 4:40pm
  •  foggyTrader
  • | Joined Jan 2006 | Status: Always look at both scenarios | 640 Posts
Quoting cuddlebum
Disliked
What does TDST stand for?
Ignored
Mr DeMark refers to TDST as T (Tom) D (DeMark) S (Setup) T (Trend). After a TD Buy setup has formed the high of the first bar in the sequence is the TDST and considered to be the market resistance level, it is where the momentum began to accelerate. The opposite applies after a TD sell setup has formed the low of the first bar in the sequence is the TDST support level.
Cheers
Foggytrader
 
 
  • Post #8
  • Quote
  • Nov 17, 2009 5:01pm Nov 17, 2009 5:01pm
  •  hensch
  • | Joined Apr 2005 | Status: $$$$ | 142 Posts
Foggytrader, very interesting thread. I'm studying your posts right now.

Keep up the good work.

Henry
 
 
  • Post #9
  • Quote
  • Nov 17, 2009 5:01pm Nov 17, 2009 5:01pm
  •  foggyTrader
  • | Joined Jan 2006 | Status: Always look at both scenarios | 640 Posts
For anyone wishing to try the indicator, here's a little more about it. When you load up the template, push ctrl i and click to edit the TD Count file. Click on "show data" true. You will then get the information shown in the picture below. The default is set to 1% of your account.

Cheers
Foggytrader

Attached Image
 
 
  • Post #10
  • Quote
  • Nov 17, 2009 5:27pm Nov 17, 2009 5:27pm
  •  hensch
  • | Joined Apr 2005 | Status: $$$$ | 142 Posts
Foggytrader, I'm still getting around all the posted info, but I placed your template and indicators on the charts and this is what I see:

First chart took a clear tarde according to rules right?

http://img35.imageshack.us/img35/8215/tdsqtrade.gif


Question on this randomly picked chart. Why did the indicator plot the lines and arrow on that bar? is that a valid set up?

http://img121.imageshack.us/img121/7875/tdsqtrade2.gif http://img121.imageshack.us/img121/t...gif/1/w800.png
 
 
  • Post #11
  • Quote
  • Nov 17, 2009 5:31pm Nov 17, 2009 5:31pm
  •  foggyTrader
  • | Joined Jan 2006 | Status: Always look at both scenarios | 640 Posts
Below I have attached the current situation ( in my opinion ) for GBPUSD and how you can utilise the DeMark method to go with the trend for low risk.

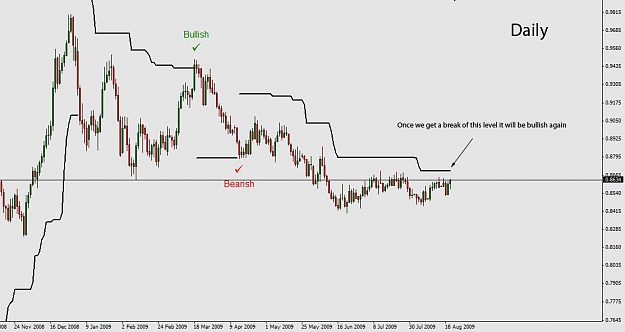
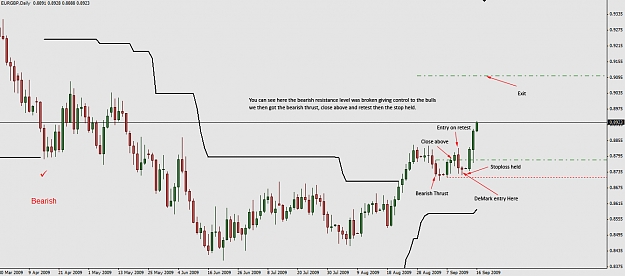
Since removing the upper BAT resistance on the weekly chart back in the first week of August GBPUSD has been Bullish on the weekly timeframe. What I look for after that is for the market to retrace somewhat (perhaps 50%, but a minimum of 25%) and make some bearish thrust bars. When we get a close above the bearish thrusts high that is the trigger and I would look to buy that level and then buy any corrections there after. So how am I going to do that? Well, it is a weekly chart and I am a small trader so the risk is too high. This is where DeMark comes in. When we get these condition and approach these levels I will drop down a few timeframes and get in with a lower risk.

Now, as you will see below, the daily resistance has also been broken recently and we have had a close back above the high of the large bearish thrust meaning this market is bullish. As I have illustrated in the pictures below, there is a possible setup there.

I have also attached a setup from earlier today (4th pic). It didn't work out in terms of the longer-term plan but partial profits were booked at the closest TDST resistance level.

Attached Image (click to enlarge)
Click to Enlarge

Name: Weekly-GBPUSD.jpg
Size: 187 KB
Attached Image (click to enlarge)
Click to Enlarge

Name: Daily.jpg
Size: 210 KB
Attached Image (click to enlarge)
Click to Enlarge

Name: 5-Minute.jpg
Size: 190 KB
Attached Image (click to enlarge)
Click to Enlarge

Name: Earlier-today.jpg
Size: 163 KB
 
 
  • Post #12
  • Quote
  • Nov 17, 2009 5:32pm Nov 17, 2009 5:32pm
  •  opie999
  • Joined Jun 2007 | Status: Know that you don't know. | 2,943 Posts
Hi, foggy.

Congrats on a great start showcasing TDST. Your chart illustrations look very professional. Clean, clear, and well rendered.

Will you be discussing DeMark's supply/demand lines?
 
 
  • Post #13
  • Quote
  • Nov 17, 2009 5:35pm Nov 17, 2009 5:35pm
  •  foggyTrader
  • | Joined Jan 2006 | Status: Always look at both scenarios | 640 Posts
Quoting hensch
Disliked
Foggytrader, I'm still getting around all the posted info, but I placed your template and indicators on the charts and this is what I see:

First chart took a clear tarde according to rules right?
Ignored
Sorry, I forgot to explain. There is a history function in the indicator. The blue arrow can be moved to the bottom of any candle and the info i.e. risk entry etc will be shown on hte left hand side of the screen. Just press ctrl i and edit the TD Count file and set the history to false and the blue arrow will go.

Cheers
Foggytrader
 
 
  • Post #14
  • Quote
  • Nov 17, 2009 5:43pm Nov 17, 2009 5:43pm
  •  foggyTrader
  • | Joined Jan 2006 | Status: Always look at both scenarios | 640 Posts
Quoting opie999
Disliked
Hi, foggy.

Congrats on a great start showcasing TDST. Your chart illustrations look very professional. Clean, clear, and well rendered.

Will you be discussing DeMark's supply/demand lines?
Ignored
Thanks Opie,

So far I just stick to trading the failures of the TDST levels plus another way which I will explain later.

I forgot to also mention that I put a number below each TDST line as I view number 1 sequences as the most significant.

Cheers
Foggytrader
 
 
  • Post #15
  • Quote
  • Nov 17, 2009 6:04pm Nov 17, 2009 6:04pm
  •  foggyTrader
  • | Joined Jan 2006 | Status: Always look at both scenarios | 640 Posts
I took this trade in USDCAD earlier today as I am already long USDCAD as the daily chart shows. Not looking great now but we will see. Nice 5 minute entry though.

Cheers
Foggytrader

Attached Image (click to enlarge)
Click to Enlarge

Name: 5-minute-entry.jpg
Size: 261 KB
Attached Image (click to enlarge)
Click to Enlarge

Name: USDCAD-Daily.jpg
Size: 247 KB
 
 
  • Post #16
  • Quote
  • Nov 17, 2009 6:12pm Nov 17, 2009 6:12pm
  •  foggyTrader
  • | Joined Jan 2006 | Status: Always look at both scenarios | 640 Posts
Took this trade, it wasn't the greatest failure but the price didn't close below the TDST support level or the low of the touch candle so thought it was worth holding. Off to bed now, I will just leave this one, its only 25 pips risk. Perhaps a nice surprise in the morning.

Cheers
Foggytrader

Attached Image (click to enlarge)
Click to Enlarge

Name: Trade-Triggered.jpg
Size: 211 KB
 
 
  • Post #17
  • Quote
  • Nov 17, 2009 6:25pm Nov 17, 2009 6:25pm
  •  opie999
  • Joined Jun 2007 | Status: Know that you don't know. | 2,943 Posts
Quoting foggyTrader
Disliked
Thanks Opie,

So far I just stick to trading the failures of the TDST levels plus another way which I will explain later.

I forgot to also mention that I put a number below each TDST line as I view number 1 sequences as the most significant.

Cheers
Foggytrader
Ignored
Sounds good. Looking forward.
 
 
  • Post #18
  • Quote
  • Nov 17, 2009 10:06pm Nov 17, 2009 10:06pm
  •  simpleguy
  • | Joined Jan 2008 | Status: Member | 517 Posts
I'm glad you are starting this thread I have become very interested in the Demark indicators since I started to use his trend lines with some very good success. It's my goal for the New Year to work on his Sequential system.

How long did it take you to learn to use his system?

What advice do you have for someone that does not use it now? where to start.

Simple
A woman drove me to drink, and I forgot to thank her
 
 
  • Post #19
  • Quote
  • Nov 18, 2009 2:40am Nov 18, 2009 2:40am
  •  foggyTrader
  • | Joined Jan 2006 | Status: Always look at both scenarios | 640 Posts
Quoting simpleguy
Disliked
I'm glad you are starting this thread I have become very interested in the Demark indicators since I started to use his trend lines with some very good success. It's my goal for the New Year to work on his Sequential system.

How long did it take you to learn to use his system?

What advice do you have for someone that does not use it now? where to start.

Simple
Ignored
Hello SimpleGuy,

How long did it take me to learn to use his system?

It only really took a couple of months to master this particular area of DeMark. However, it took longer to realise when to take each signal. As I have mentioned in a previous post, I feel it is important to have an overall plan, a view on the longer-term path of a pair then use DeMark to build up positions in a certain direction. For sure, this particular method can be used for intraday, in and out trading but one can’t follow all pairs on a 5 minute chart everyday and expect to live past 50, it is just too much.

Here is an example, back in August I had a view of EURGBP as you can see from the first picture. I was looking for it to break the upper resistance then I would look to go long after the minimum 25% retracement. As you can see from the second picture, this all materialised. Now the third picture shows a DeMark entry on the 5 minute chart which was close to the stoploss level for the longer-term trade as illustrated in the second picture.

Attached Image (click to enlarge)
Click to Enlarge

Name: EURGBP-Daily.jpg
Size: 62 KB


Attached Image (click to enlarge)
Click to Enlarge

Name: EURGBP-Daily-entry.jpg
Size: 218 KB


Attached Image (click to enlarge)
Click to Enlarge

Name: Demark-EURGBP.jpg
Size: 284 KB


The risk on the 5 minute chart in the example above was only 12 pips giving you the chance to have a good number of lots heading for your first target. You will only need a couple of these situations per year and you will make a good return. Unfortunately I was still caddying at this point so missed this particular opportunity.

What advice do I have for someone that does not use it now? Where to start?

Well, I would say firstly trading the way I have developed is a good place to start. If you are serious about DeMark I would advise buying Jason Pearls book “DeMark Indicators (Bloomberg Market Essentials: Technical Analysis)”. You will learn a lot from this book as the DeMark method has numerous ways of trading. Basically, try this out on a demo first until you get used to the setups and the scripts. The risk is set at 1% which I think is perfect for a low risk entry method like DeMark (depending on the TF). Also, if you have any other questions please don’t hesitate to ask.

Cheers
Foggytrader
 
 
  • Post #20
  • Quote
  • Nov 18, 2009 3:00am Nov 18, 2009 3:00am
  •  foggyTrader
  • | Joined Jan 2006 | Status: Always look at both scenarios | 640 Posts
Below is the current daily chart of EURGBP. The lower BAT support was broken yesterday giving a short-term opportunity.

Cheers
Foggytrader

Attached Image (click to enlarge)
Click to Enlarge

Name: EURGBP-Daily-181109.jpg
Size: 206 KB
 
 
  • Trading Systems
  • /
  • DeMark TDST Trading
  • Reply to Thread
    • Page 1 23456 27
    • Page 1 234 27
0 traders viewing now
  • More
Top of Page
  • Facebook
  • Twitter
About FF
  • Mission
  • Products
  • User Guide
  • Media Kit
  • Blog
  • Contact
FF Products
  • Forums
  • Trades
  • Calendar
  • News
  • Market
  • Brokers
  • Trade Explorer
FF Website
  • Homepage
  • Search
  • Members
  • Report a Bug
Follow FF
  • Facebook
  • Twitter

FF Sister Sites:

  • Metals Mine
  • Energy EXCH
  • Crypto Craft

Forex Factory® is a brand of Fair Economy, Inc.

Terms of Service / ©2023