• Home
  • Forums
  • Trades
  • News
  • Calendar
  • Market
  • Brokers
  • Login
  • Join
  • User/Email: Password:
  • 2:12am
Menu
  • Forums
  • Trades
  • News
  • Calendar
  • Market
  • Brokers
  • Login
  • Join
  • 2:12am
Sister Sites
  • Metals Mine
  • Energy EXCH
  • Crypto Craft

Options

Bookmark Thread

First Page First Unread Last Page Last Post

Print Thread

Similar Threads

Volume Spread Analysis (VSA) and background 5 replies

Trading With VSA - Volatile Volume and Spread Analysis 9 replies

What is the best VSA (Volume Spread Analysis) system/indicator? 1 reply

Volume Spread Analysis (VSA) and the EURUSD 3 replies

VSA Volume Spread Analysis: No demand and accumlation 2 replies

  • Commercial Content
  • /
  • Reply to Thread
  • Subscribe
  • 2,519
Attachments: Trade Using VSA (Volume Spread Analysis)
Exit Attachments

Trade Using VSA (Volume Spread Analysis)

  • Last Post
  •  
  • 1 190191Page 192193194 445
  • 1 Page 192 445
  •  
  • Post #3,821
  • Quote
  • Oct 23, 2009 6:17am Oct 23, 2009 6:17am
  •  kermut
  • | Joined Sep 2005 | Status: Member | 327 Posts
Many thanks for you reply HG. I shall study the charts and your comments and get back to you.

Regards,
K.

BTW, I was not around nor am I familiar with twobuckchuck, but I do wish him a speedy recovery. When someone is injured, it is not just the person, but the family around them that is also affected, and my thoughts are with them.
 
 
  • Post #3,822
  • Quote
  • Oct 23, 2009 4:49pm Oct 23, 2009 4:49pm
  •  s21
  • | Joined Jul 2009 | Status: Member | 81 Posts
i'm new on this thread and i'm trying to understand something: if you trade the major's fx pairs and the tick volume it's very subjective, does'nt matter through what company you trade, it's not a clearer image if you look at volume from futures market relating to that currency? thank's...
"Imagination is more important than knowledge" Einstein
 
 
  • Post #3,823
  • Quote
  • Oct 23, 2009 5:51pm Oct 23, 2009 5:51pm
  •  farizu
  • | Joined Mar 2009 | Status: Member | 67 Posts
Quoting Shamus
Disliked
I have some sad news to report. As most of you know TwoBuckChuck and I were working on the VSA trainer together and have become good friends over these many months. A few weeks ago as we were finishing up some stuff Chuck essentially disappeared and I hadn't heard anything from him for some time. I was concerned something may have happened to him, and online friendships being the way they are I had no real contact info other than some email address, and instant messenger nicks for him.

I kept emailing him hoping that he would pop up eventually...
Ignored
Sorry to hear this, but here's wishing Chuck a speedy recovery...
 
 
  • Post #3,824
  • Quote
  • Oct 23, 2009 6:55pm Oct 23, 2009 6:55pm
  •  tfflyer
  • | Joined Sep 2007 | Status: Member | 1,404 Posts
CHART
Attached Image (click to enlarge)
Click to Enlarge

Name: SAFDSFSA.PNG
Size: 136 KB
 
 
  • Post #3,825
  • Quote
  • Oct 23, 2009 11:42pm Oct 23, 2009 11:42pm
  •  ozziedave
  • Joined May 2007 | Status: Ozziedave | 1,661 Posts
Quoting HiddenGap
Disliked
Good question Tfflyer. I can always count on you to keep things interesting.

As I said, I do not use this particular technique. The way I understand it, the focus is on the close and not the volume. That is to say, if you are short and the third close is a narrow range up bar on volume less than the previous two candles, you would exit. Not withstanding the fact that this candle is No Demand.

As a trader becomes more comfortable with volume, I would make sense that exception would be made when the volume is "screaming" stay in the trade....
Ignored
Hi HG...

Been reading this thread for days now. Still struggling to get my head around it. I see you talk about Wide Range Body Analysis. Where can I get more info about WRBA?
 
 
  • Post #3,826
  • Quote
  • Oct 24, 2009 5:38am Oct 24, 2009 5:38am
  •  denbur
  • | Joined Sep 2008 | Status: Member | 96 Posts
i put my comments on the chart

Quoting tfflyer
Disliked
CHART
Ignored
Attached Image (click to enlarge)
Click to Enlarge

Name: 10-24-2009 1-32-46 PM.png
Size: 174 KB
 
 
  • Post #3,827
  • Quote
  • Oct 24, 2009 8:13am Oct 24, 2009 8:13am
  •  tfflyer
  • | Joined Sep 2007 | Status: Member | 1,404 Posts
Hi Denbur,

thanks for reply and comments.

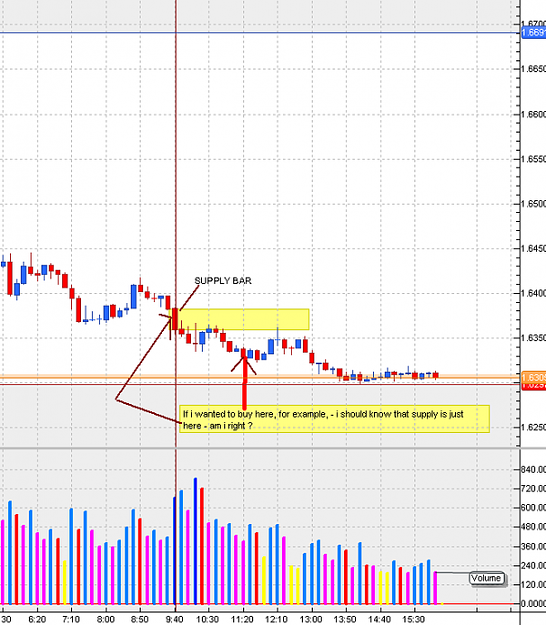
If i saw that bar You mention as Bar Nr 1, i would think that demand is overtaking supply, this is how i think in present time..

I am sure - i would look for some buying opportunity and quite fast i would be in loss

Where i am wrong - what i dont see except that overall we are ( was ) today on picture DOWN.. ?


Best,
Tom
 
 
  • Post #3,828
  • Quote
  • Oct 25, 2009 7:03am Oct 25, 2009 7:03am
  •  denbur
  • | Joined Sep 2008 | Status: Member | 96 Posts
Tom,

I don't know what you are usually looking for when taking a trade to tell you what is missing

In my opinion there are 3 things here interesting:
1. Volume had dropped on the move down, plus spread got narrow.
2. if there is a some sort of support on the left, we cant see that on that screen shot. But if it is there and market is testing that level, there is no reaction, no buying, nothing, no one interested in this level that gives me idea to stay away from buying too.
3. There are high volume bars but no reaction at all.

I would move to a higher time frame in this particular example to get a clearer picture.

hope this helps...

Den
Quoting tfflyer
Disliked
Hi Denbur,

thanks for reply and comments.

If i saw that bar You mention as Bar Nr 1, i would think that demand is overtaking supply, this is how i think in present time..

I am sure - i would look for some buying opportunity and quite fast i would be in loss

Where i am wrong - what i dont see except that overall we are ( was ) today on picture DOWN.. ?


Best,
Tom
Ignored
 
 
  • Post #3,829
  • Quote
  • Oct 25, 2009 8:03am Oct 25, 2009 8:03am
  •  tfflyer
  • | Joined Sep 2007 | Status: Member | 1,404 Posts
Thanks Den for Your comments.

That my buying was mainly just as example for supply bar which we talked..

But i got good point i think so, that, if price gets on some s/r with lower volume, like in this example, and there is no reaction to this support with previus lower volume, we can expect lower price.


Thank You.

Best,
Tom

Quoting denbur
Disliked
Tom,

I don't know what you are usually looking for when taking a trade to tell you what is missing

In my opinion there are 3 things here interesting:
1. Volume had dropped on the move down, plus spread got narrow.
2. if there is a some sort of support on the left, we cant see that on that screen shot. But if it is there and market is testing that level, there is no reaction, no buying, nothing, no one interested in this level that gives me idea to stay away from buying too.
3. There are high volume bars but no reaction at all.

I would move...
Ignored
 
 
  • Post #3,830
  • Quote
  • Oct 25, 2009 4:54pm Oct 25, 2009 4:54pm
  •  Thirdsector
  • | Joined Jun 2009 | Status: Member | 16 Posts
Quoting hoichoi
Disliked
I think
VSA + POC + VAH + VAL + VWAP .. is the best combination to trade..
i can see malcom is using POC / VAH / VAL from previous day to look for setup... thats very good combination....
Ignored
Been lurking for a while and have to thank the pros (Malcolm, HG, Dr. G, especially) for their huge contribution. While I'm far from applying this info in live trading, I hope to add some analysis charts soon to test my mettle. I've read though the thread and I think I understand most of the acronyms but I'm at a loss for understanding some of the above quote.

VWAP= Volume Weighted Adjusted Price
POC= Point Of Control, or Peak Price from Market Profile histogram
VSA= well, I think we know that one....

But I don't know what VAH or VAL stand for. Is this Volume Adjusted High and Volume Adjusted Low? How do we identify these effectively in MT4? Could someone clear this up for me?

Thanks in advance,

s
 
 
  • Post #3,831
  • Quote
  • Oct 25, 2009 5:01pm Oct 25, 2009 5:01pm
  •  Thirdsector
  • | Joined Jun 2009 | Status: Member | 16 Posts
Quoting taomql4
Disliked
indy's are truly a waste of time,
Now am down to my pivot points and loving it .........
all they do is to manipulate PRICE and VOLUME when that's
exactly what am trying to get at(RAW data)..

Learn to read tape and you are home free....
Ignored
This is a question to anyone actively using VSA:

I've used both Pivots and MML (Murrey Math Lines) and was wondering which seems to give better support to VSA analysis?

s
 
 
  • Post #3,832
  • Quote
  • Oct 25, 2009 8:56pm Oct 25, 2009 8:56pm
  •  HiddenGap
  • Joined Aug 2009 | Status: Reading the tape | 2,297 Posts
VWAP= Volume Weighted Average Price
VAL= Value Area Low
VAH= Value Area High

VAL & VAH are terms used in Market Profile. Another MP term you might see here is Naked, or Virgin, POC. This is a previous POC that had not been re-touched by price action.
The Market is either drawing to liquidity or running to an imbalance.
 
 
  • Post #3,833
  • Quote
  • Oct 25, 2009 11:17pm Oct 25, 2009 11:17pm
  •  sinner-
  • Joined Apr 2009 | Status: RETIRED | 1,947 Posts
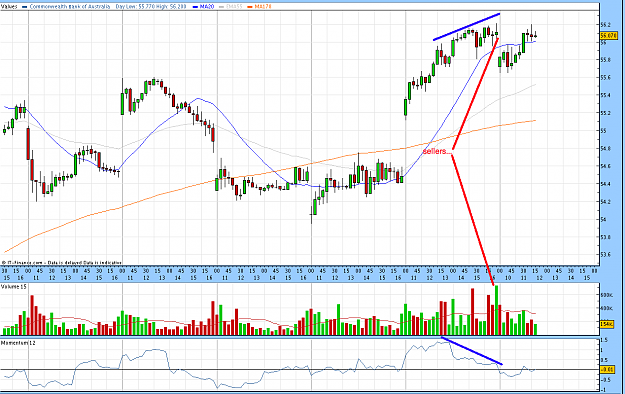
Hi guys, this is not a forex chart but was wondering if I could get your opinion on it anyway.

High volume Australian bank stock, traded very high into the final 15 minutes before close, I am assuming sellers, but would like confirmation from someone with a bit more experience. I feel my thoughts are confirmed by todays trading, stock moving up on declining volume.
Attached Image (click to enlarge)
Click to Enlarge

Name: Picture 1.png
Size: 53 KB
 
 
  • Post #3,834
  • Quote
  • Oct 26, 2009 1:17am Oct 26, 2009 1:17am
  •  denbur
  • | Joined Sep 2008 | Status: Member | 96 Posts
Hi,

this is just my point of view on this chart.

1. this is first time when Supply came in. High Volume narrow spread bar.
2. this is the reaction of the supply. Down bar on Volume less than previous two bars. No continuation of the supply.
3. Second time High Volume comes in and takes market down.
4. this bar shows lack of continuation of the supply, second time already.

by this point Volume on down bars is diminishing as prices came down. This indicates lack of selling.

5. Volume increase on up bars into the area where we had supply. Demand is still present in my opinion.
6. Down bars on reduced Volume after we had no selling continuation and demand coming in on up bars.

in my opinion this stock has not been distributed properly, at this moment. Someone tried to distribute it but failed.

What I would look for:
1. if market starts testing area #7 on low volume I would buy.
2. if new supply comes in at area #7 at would step aside and wait for no demand.

this is just my view of this picture. Actually it is difficult for me to tell that I would buy anything in the stock market at the moment after supply came into the stock market last week.

Hope this helps

Den

Quoting sinner-
Disliked
Hi guys, this is not a forex chart but was wondering if I could get your opinion on it anyway.

High volume Australian bank stock, traded very high into the final 15 minutes before close, I am assuming sellers, but would like confirmation from someone with a bit more experience. I feel my thoughts are confirmed by todays trading, stock moving up on declining volume.
Ignored
Attached Image
 
 
  • Post #3,835
  • Quote
  • Oct 26, 2009 5:53am Oct 26, 2009 5:53am
  •  tfflyer
  • | Joined Sep 2007 | Status: Member | 1,404 Posts
Thanks Den for comments.

Looks like Volume indi is good when there is possible to see just on Volume bars which is up bar on price chart and which is down bar.

Best,
Tom
 
 
  • Post #3,836
  • Quote
  • Oct 27, 2009 3:19pm Oct 27, 2009 3:19pm
  •  GoldStandard
  • | Joined Nov 2008 | Status: Member | 28 Posts
Hi all - I just found something that might be of interest to those frustrated with the varying quality of MT4 brokers' volume feeds. Dukascopy.com now has live charts on their home page, down to the 10 second time frame. No need to open an acount or buy a data feed from them. To turn on volume go to options on a chart, and its listed as one of the oscillators there.
 
 
  • Post #3,837
  • Quote
  • Oct 27, 2009 3:42pm Oct 27, 2009 3:42pm
  •  tfflyer
  • | Joined Sep 2007 | Status: Member | 1,404 Posts
Thanks Gold !


Best,
Tom
 
 
  • Post #3,838
  • Quote
  • Edited at 4:12pm Oct 27, 2009 4:00pm | Edited at 4:12pm
  •  tfflyer
  • | Joined Sep 2007 | Status: Member | 1,404 Posts
Gold - How is reloading Your dukas copy charts - automaticaly ?
Mine is not reloading..

EDIT:
I just understood - they are reloading after timeframe, lets say, You have 1 min charts - They will reload after 1 min, etc..

Best,
Tom
 
 
  • Post #3,839
  • Quote
  • Oct 28, 2009 9:24am Oct 28, 2009 9:24am
  •  tfflyer
  • | Joined Sep 2007 | Status: Member | 1,404 Posts
Hello everyone,
if possible,
could someone post GBP/USD daily chart.

I would like to see those who have like GTIS forex data feed or some other professional data feed.

And which data feed is best for longer term view ? The same any professional data feed which for intraday ?

Thank You for Your time to answer!

Best,
Tom
 
 
  • Post #3,840
  • Quote
  • Oct 28, 2009 1:44pm Oct 28, 2009 1:44pm
  •  tfflyer
  • | Joined Sep 2007 | Status: Member | 1,404 Posts
Also, if someone can, please post also not only day chart, but also todays 10 min charts for GBP/USD which comes from professional data feed.

Thank You !


Best,
Tom
 
 
  • Commercial Content
  • /
  • Trade Using VSA (Volume Spread Analysis)
  • Reply to Thread
    • 1 190191Page 192193194 445
    • 1 Page 192 445
1 trader viewing now
  • More
Top of Page
Forex Factory Blog Updated: Alerting All Members
  • Facebook
  • Twitter
About FF
  • Mission
  • Products
  • User Guide
  • Media Kit
  • Blog
  • Contact
FF Products
  • Forums
  • Trades
  • Calendar
  • News
  • Market
  • Brokers
  • Trade Explorer
FF Website
  • Homepage
  • Search
  • Members
  • Report a Bug
Follow FF
  • Facebook
  • Twitter

FF Sister Sites:

  • Metals Mine
  • Energy EXCH
  • Crypto Craft

Forex Factory® is a brand of Fair Economy, Inc.

Terms of Service / ©2022