Have no idea why, but without a peep for a long time (like a year), all of a sudden, I have 5 PM's.. Some of which I ignore and some of which I reply to.
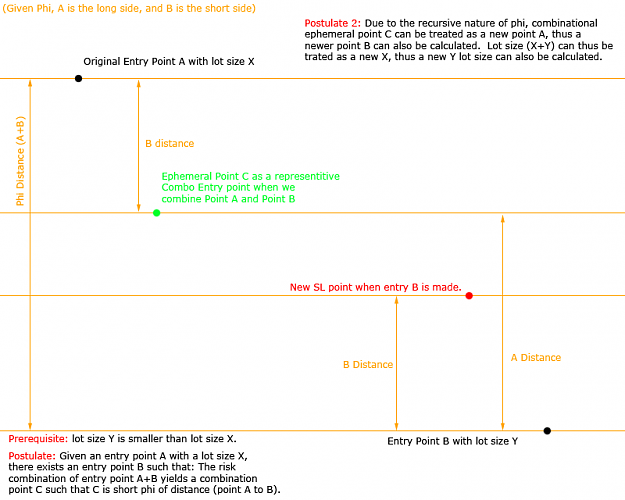
So while I'm logged in; I thought I might as well jot down for some that have asked; about 3 weeks ago, (after 2+ years) although I had always conjectured it to be true; I finally was able to give a mathematical formula to prove that for a given entry position size; there exists an optimized add-on position and pip distance such that profit is maximized and risk is minimized. Indeed my theory of a mini-max (saddlepoint) on a bi-axle risk/reward plot DOES exist.
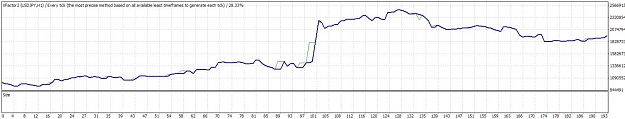
Based and built on both phi and e, I was able to write into an equation that is optimized; with similar characteristics of a fractal formation; a "drill down" of the equation reveals the same equation (bits).
So I'm here to encourage all of you out there; 4~8 hours a day, 2+ years in a row, yields results.
Those of you not so inclined in math; I highly recommend you just stick to the pascal triangles.. It's systematically easy to use and fairly optimized; even though it's not systematically maximized.
So that's 1 down, 2 major math hurdles left..
So while I'm logged in; I thought I might as well jot down for some that have asked; about 3 weeks ago, (after 2+ years) although I had always conjectured it to be true; I finally was able to give a mathematical formula to prove that for a given entry position size; there exists an optimized add-on position and pip distance such that profit is maximized and risk is minimized. Indeed my theory of a mini-max (saddlepoint) on a bi-axle risk/reward plot DOES exist.
Based and built on both phi and e, I was able to write into an equation that is optimized; with similar characteristics of a fractal formation; a "drill down" of the equation reveals the same equation (bits).
So I'm here to encourage all of you out there; 4~8 hours a day, 2+ years in a row, yields results.
Those of you not so inclined in math; I highly recommend you just stick to the pascal triangles.. It's systematically easy to use and fairly optimized; even though it's not systematically maximized.
So that's 1 down, 2 major math hurdles left..
google: