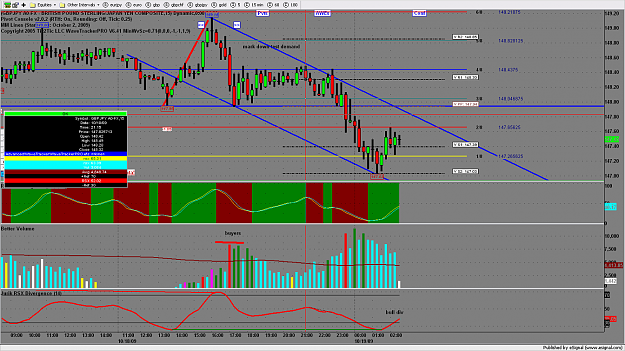
got in short gj at 147.50. stops real close though at BE already so might get stopped out if it doesnt drop from here
Ignored
your position is right at the support. Why not wait for breakout then have a pending order at the support? I much safer, doesn't it? If you like to gamble, then long right at the support then.. Your rationale positioning your trade really confuses me..
I think that is why you short, price go up and vice versa..
you mean the hammer in 1hr that spike right to the F38? Let's see where current 1hr candle close
Ignored
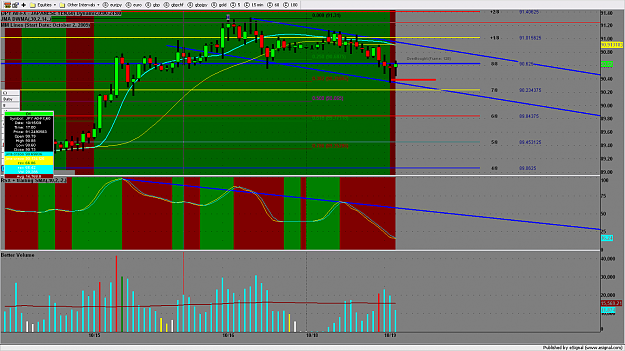
Nope..based on probabilty...the 30mn trend is down for me...the 5mn as well..and in the 5mn it hit resistance (ichimoku indicator)..so there is a like a 80% of chance of going down
I have a 20% of chance of being wrong, i'll try it
short at 90.64...tp 90.15 for now
your position is right at the support. Why not wait for breakout then have a pending order at the support? I much safer, doesn't it? If you like to gamble, then long right at the support then.. Your rationale positioning your trade really confuses me..
I think that is why you short, price go up and vice versa..
Ignored
what support? i see support at 147, resistance 147.70 area, but not 147.50.
stopped out when uj spiked up anyway. its a bit jumpy at the moment
Nope..based on probabilty...the 30mn trend is down for me...the 5mn as well..and in the 5mn it hit resistance (ichimoku indicator)..so there is a like a 80% of chance of going down
I have a 20% of chance of being wrong, i'll try it
short at 90.64...tp 90.15 for now
Ignored
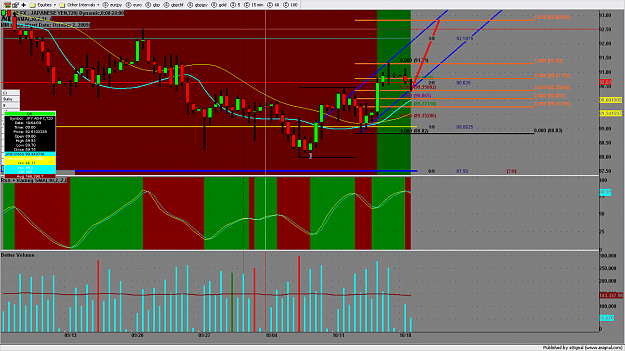
how about in 1hr then? If current candle manage to close above the hammer.. then I think, it will go up.. and i guess there is 80% chance hammer at support will move up, not down.. just my 2 cents..
how about in 1hr then? If current candle manage to close above the hammer.. then I think, it will go up.. and i guess there is 80% chance hammer at support will move up, not down.. just my 2 cents..
Ignored
Yeh indeed you are right i might be wrong...but i have more chance of being right than wrong so i give it a try
btw i only check 30mn and 5mn UT...it always worked for me so i'll keep it this way
Yeh indeed you are right i might be wrong...but i have more chance of being right than wrong so i give it a try
btw i only check 30mn and 5mn UT...it always worked for me so i'll keep it this way
Ignored
If you really want to short, I think the best place/ logical place is at 90.75 (might be the resistance turned support turned resistance )
Yeh indeed you are right i might be wrong...but i have more chance of being right than wrong so i give it a try
btw i only check 30mn and 5mn UT...it always worked for me so i'll keep it this way
Ignored
60 min uj is bull flag ... would not bother shorting it with that pin bar at a 38 % retracement only
if you insist on shorting wait for re test 91 and see if there is still valid reason to
if you want to understand and trade vsa looks at all time frames
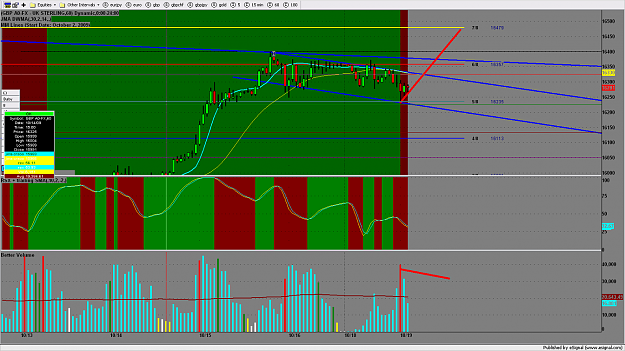
move down low volume on 30 and 60 min on retracement
massive buying at 147
you are now shorting against the pros buying
we could be in range now 147 to 149
Ignored
hmmm im seeing the opposite. down move with more volume and volume dropped off since its been moving up. or is that because the extra volume on the down move was hidden buying? meaning they are already long now so the lower volume now just means they are already in?
hmmm im seeing the opposite. down move with more volume and volume dropped off since its been moving up. or is that because the extra volume on the down move was hidden buying? meaning they are already long now so the lower volume now just means they are already in?
thought you went to sleep lol
Ignored
I did 1 hr only for now ..wanted to see test 147 for long ... could see down move low vol
lets see me using vsa 2 years ... you using it 2 weeks ..lol .. who do you think is right ?
I think 1.6320 is too shallow bro for the confirmation of the march.. I'm thinking breakout of the 1.6370.. that will truly confirms the move to more upside..