• Home
  • Forums
  • Trades
  • News
  • Calendar
  • Market
  • Brokers
  • Login
  • Join
  • User/Email: Password:
  • 8:21pm
Menu
  • Forums
  • Trades
  • News
  • Calendar
  • Market
  • Brokers
  • Login
  • Join
  • 8:21pm
Sister Sites
  • Metals Mine
  • Energy EXCH
  • Crypto Craft

Options

Bookmark Thread

First Page First Unread Last Page Last Post

Print Thread

Similar Threads

Volume Spread Analysis (VSA) and background 5 replies

Trading With VSA - Volatile Volume and Spread Analysis 9 replies

What is the best VSA (Volume Spread Analysis) system/indicator? 1 reply

Volume Spread Analysis (VSA) and the EURUSD 3 replies

VSA Volume Spread Analysis: No demand and accumlation 2 replies

  • Commercial Content
  • /
  • Reply to Thread
  • Subscribe
  • 2,519
Attachments: Trade Using VSA (Volume Spread Analysis)
Exit Attachments

Trade Using VSA (Volume Spread Analysis)

  • Last Post
  •  
  • 1 187188Page 189190191 445
  • 1 Page 189 445
  •  
  • Post #3,761
  • Quote
  • Oct 14, 2009 6:49pm Oct 14, 2009 6:49pm
  •  denbur
  • | Joined Sep 2008 | Status: Member | 96 Posts
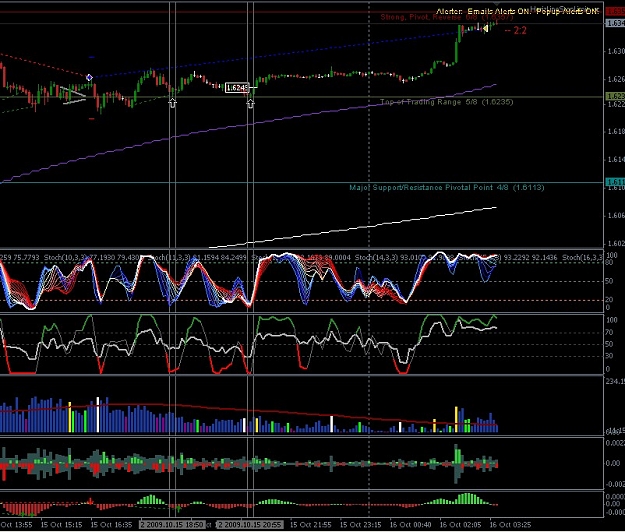
I think he is saying that every bar is unique and exists in a context. you need to pay attention of what is going on in the background. you cant take a bar in isolation and apply same description again and again. every time it is a different story, it is unique order flow every time.

in my opinion this is more into the area of order flow trading than vsa bar reading...


Quoting tfflyer
Disliked
Hi Zoli,

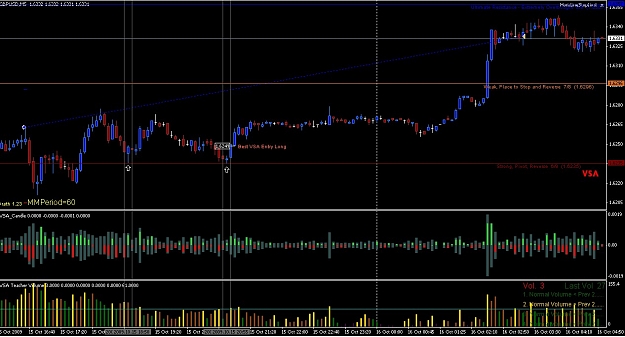
that is from page 49 from T. W. Book - Undeclared market secrets.

This text could be in any page of Toms book... Such things in Toms books are a lot.

Here i attached this page.


Best,
Tom
Ignored
 
 
  • Post #3,762
  • Quote
  • Oct 14, 2009 9:27pm Oct 14, 2009 9:27pm
  •  kermut
  • | Joined Sep 2005 | Status: Member | 327 Posts
Hello All,

I have been reading the thread and the links to the articles and webpages intently, and trying to get a better understanding of vsa.

I have a few questions, which I hope that the veterans will be kind to answer.

As Dr. G, HiddenGap and malcolm have said quite often, that we always need to pay attention to what has happend in the left of the screen to be able to analyse what is happening in the now. What might seem like an effort to fall bar, could easily be a test of the upper zone a high volume high spread up bar in the left of the screen.

My question is this: how far back to look? Do the traders that start their job at 8am in London, try to exit their positions before london close? and do the ny traders who start at 8am EST try to exit their positions by the end of the day? When looking at a 5M chart, should we also be looking at the daily chart, and looking for the high spread, narrow spread, high volume days, and drawing our lines in the body of that bar, and see how 5M charts are reacting to them? Or should we just look at the 15M chart (as a few veteran traders from FF have repeated mentioned in various sections of FF that most pro and bank traders they know have a 15M chart up of whatever they are trading).

Sorry for the long rambling, but I am just trying to understand how far back to look in a 5M chart to establish the high volume bars. Obv, asian session does not really have much volume, so do we place much importance on any of the high volume bars during the asian session?

Many thanks in advance.

Regards,
K.
 
 
  • Post #3,763
  • Quote
  • Oct 14, 2009 9:38pm Oct 14, 2009 9:38pm
  •  HiddenGap
  • Joined Aug 2009 | Status: Reading the tape | 2,297 Posts
Quoting tfflyer
Disliked
HiddenGap,
what You think about bar tick charts ? I have heard some are trading from bar tick charts and not based on bar time charts.

Thanks.


Best,
Tom
Ignored
Tom, I have not used tick chart so what I have to say needs to be taken with a grain of salt.

First, I really like the idea that a chart will "Speed" up when there is more activity. Understanding the rate at which the chart is unfolding can be valuable.

Now for the problems:

1. I am told by a few that use tick charts that it eliminates many Wide Range Bodies found on time charts. This is of course tied to speed but is distinct enough to be mentioned separately.

WRB analysis can be done on tick charts, time charts and volume charts. I am cautious of tick charts, however, because a trader I highly respect mentioned to me the main reason he uses them is to minimize the WRBs.

2. Volume Spread Analysis compares the volume on bar on to some bar in the past or future. If all bars are completed on the same volume (tick) then, what is there to compare? I have seen tick charts with volume on the bottom but I do not understand where the volume is coming from. Ticks charts imply that a bar is complete after x ticks. That x is constant for all bars so I don't know how volume can be used as a separate analysis tool.

If it is actual volume being used than one can't make a relative comparison. Bar one might of completed in 5 minutes and bar two might of completed in 8 minutes. You can't really interpret these two bars from a VSA standpoint because the constant they don't share is time.

With all that said, I understand that TradeGuider will have tick charts on the next release. So apparently they know something that I don't.
The Market is either drawing to liquidity or running to an imbalance.
 
 
  • Post #3,764
  • Quote
  • Oct 15, 2009 1:25am Oct 15, 2009 1:25am
  •  denbur
  • | Joined Sep 2008 | Status: Member | 96 Posts
you can have tick chart with real volume. the volume is coming from DOM.

Quoting HiddenGap
Disliked
Tom, I have not used tick chart so what I have to say needs to be taken with a grain of salt.

First, I really like the idea that a chart will "Speed" up when there is more activity. Understanding the rate at which the chart is unfolding can be valuable.

Now for the problems:

1. I am told by a few that use tick charts that it eliminates many Wide Range Bodies found on time charts. This is of course tied to speed but is distinct enough to be mentioned separately.

WRB analysis can be done on tick charts, time charts and volume charts. I am...
Ignored
 
 
  • Post #3,765
  • Quote
  • Oct 15, 2009 4:38am Oct 15, 2009 4:38am
  •  tfflyer
  • | Joined Sep 2007 | Status: Member | 1,404 Posts
Thanks HG for comments.

Best,
Tom


Quoting HiddenGap
Disliked
Tom, I have not used tick chart so what I have to say needs to be taken with a grain of salt.

First, I really like the idea that a chart will "Speed" up when there is more activity. Understanding the rate at which the chart is unfolding can be valuable.

Now for the problems:

1. I am told by a few that use tick charts that it eliminates many Wide Range Bodies found on time charts. This is of course tied to speed but is distinct enough to be mentioned separately.

WRB analysis can be done on tick charts, time charts and volume charts. I am...
Ignored
 
 
  • Post #3,766
  • Quote
  • Oct 15, 2009 5:41pm Oct 15, 2009 5:41pm
  •  forex shark
  • | Joined Feb 2007 | Status: Member | 35 Posts
Hi everyone,

I have been studying VSA for a week now and I saw this passable trade and I was wondering what you VSA traders thoughts are about this. Am I seeing things or is this a good probability trade.

Thanks Everyone,
Shark
Attached Image (click to enlarge)
Click to Enlarge

Name: 519463 FXDD - MetaTrader - [GBPUSD,M5].jpg
Size: 190 KB
 
 
  • Post #3,767
  • Quote
  • Oct 15, 2009 6:09pm Oct 15, 2009 6:09pm
  •  denbur
  • | Joined Sep 2008 | Status: Member | 96 Posts
if you enter at 1.6249, stop below 1.6235 + spread is about 15-19 pips (depending on the broker). next resistance at 1.6263, ithis is 14 pips from your entry. now is the question: why would you risk more than you can profit?

order flow is looking better on 1 hour time frame. on 5 min it has too much information in this particular case.

Quoting forex shark
Disliked
Hi everyone,

I have been studying VSA for a week now and I saw this passable trade and I was wondering what you VSA traders thoughts are about this. Am I seeing things or is this a good probability trade.

Thanks Everyone,
Shark
Ignored
 
 
  • Post #3,768
  • Quote
  • Oct 15, 2009 6:26pm Oct 15, 2009 6:26pm
  •  forex shark
  • | Joined Feb 2007 | Status: Member | 35 Posts
Quoting denbur
Disliked
if you enter at 1.6249, stop below 1.6235 + spread is about 15-19 pips (depending on the broker). next resistance at 1.6263, ithis is 14 pips from your entry. now is the question: why would you risk more than you can profit?

denbur,
Order flow is looking better on 1 hour time frame. on 5 min it has too much information in this particular case.
Ignored
I would do this trade because I am trading with the trend and it looked like a pretty good signal. I know I could be wrong and I understand risk to reword ratio is not as good as it could be. This is why I am asking.
 
 
  • Post #3,769
  • Quote
  • Oct 15, 2009 6:28pm Oct 15, 2009 6:28pm
  •  denbur
  • | Joined Sep 2008 | Status: Member | 96 Posts
ok.

i dont see a trend on this 5 min chart.

Quoting forex shark
Disliked
I would do this trade because I am trading with the trend and it looked like a pretty good signal. I know I could be wrong and I understand risk to reword ratio is not as good as it could be. This is why I am asking.
Ignored
 
 
  • Post #3,770
  • Quote
  • Oct 15, 2009 8:46pm Oct 15, 2009 8:46pm
  •  forex shark
  • | Joined Feb 2007 | Status: Member | 35 Posts
Quoting denbur
Disliked
ok.

i dont see a trend on this 5 min chart.
Ignored
No one can see a trend on a 5 min chart. You have to go to a 15 or 1hour chart. Please tell me your kidding Well...I guess we can now see where it ended up.
Attached Image (click to enlarge)
Click to Enlarge

Name: vsa 2.jpg
Size: 150 KB
 
 
  • Post #3,771
  • Quote
  • Oct 15, 2009 9:13pm Oct 15, 2009 9:13pm
  •  malcolmb14
  • Joined Apr 2007 | Status: HARD SHYT SCUBA TRADER | 20,883 Posts
Quoting forex shark
Disliked
Hi everyone,

I have been studying VSA for a week now and I saw this passable trade and I was wondering what you VSA traders thoughts are about this. Am I seeing things or is this a good probability trade.

Thanks Everyone,
Shark
Ignored

NO1 ....take of all those indicators that are cluttering up the chart ...THEY ARE A WASTE OF TIME AND SPACE ...lol

and 2ndly repost chart so I can see the trade ... then i will give you some nice feed back

vsa is all about prue volume and price action ... indies not required (ok you can keep rsi to spot diveregences) get rid of every thing else if i were you ,
Blogging daily now at www.volume.zone
 
 
  • Post #3,772
  • Quote
  • Oct 15, 2009 9:14pm Oct 15, 2009 9:14pm
  •  malcolmb14
  • Joined Apr 2007 | Status: HARD SHYT SCUBA TRADER | 20,883 Posts
Quoting denbur
Disliked
if you enter at 1.6249, stop below 1.6235 + spread is about 15-19 pips (depending on the broker). next resistance at 1.6263, ithis is 14 pips from your entry. now is the question: why would you risk more than you can profit?

order flow is looking better on 1 hour time frame. on 5 min it has too much information in this particular case.
Ignored
party pooper , if trend is up and you get vsa set up , does not matter 10 pip or 100 pip take it ... I do all the time
Blogging daily now at www.volume.zone
 
 
  • Post #3,773
  • Quote
  • Oct 15, 2009 9:41pm Oct 15, 2009 9:41pm
  •  forex shark
  • | Joined Feb 2007 | Status: Member | 35 Posts
Quoting malcolmb14
Disliked
NO1 ....take of all those indicators that are cluttering up the chart ...THEY ARE A WASTE OF TIME AND SPACE ...lol

and 2ndly repost chart so I can see the trade ... then i will give you some nice feed back

vsa is all about prue volume and price action ... indies not required (ok you can keep rsi to spot diveregences) get rid of every thing else if i were you ,
Ignored
Hi to use VSA i only use volume but I have 3 different strategy for trading and VSA is just the new one. I need the indi's for the other trading I do
 
 
  • Post #3,774
  • Quote
  • Oct 15, 2009 9:58pm Oct 15, 2009 9:58pm
  •  forex shark
  • | Joined Feb 2007 | Status: Member | 35 Posts
Quoting malcolmb14
Disliked
NO1 ....take of all those indicators that are cluttering up the chart ...THEY ARE A WASTE OF TIME AND SPACE ...lol

and 2ndly repost chart so I can see the trade ... then i will give you some nice feed back

vsa is all about prue volume and price action ... indies not required (ok you can keep rsi to spot diveregences) get rid of every thing else if i were you ,
Ignored
Is this better for ya...lol
Attached Image (click to enlarge)
Click to Enlarge

Name: vsa 3.jpg
Size: 155 KB
 
 
  • Post #3,775
  • Quote
  • Oct 15, 2009 10:51pm Oct 15, 2009 10:51pm
  •  malcolmb14
  • Joined Apr 2007 | Status: HARD SHYT SCUBA TRADER | 20,883 Posts
Quoting forex shark
Disliked
Is this better for ya...lol
Ignored

I trade 100 % using vsa ....

here is what you saw and good long ... of course trend is also up on higher time frames and we have seen nothing but buying in the back ground

the dotted line is vwap , pink = point of control ( form a volume histogram for the session)


Attached Image (click to enlarge)
Click to Enlarge

Name: chart853.png
Size: 185 KB
Blogging daily now at www.volume.zone
 
 
  • Post #3,776
  • Quote
  • Oct 15, 2009 11:42pm Oct 15, 2009 11:42pm
  •  forex shark
  • | Joined Feb 2007 | Status: Member | 35 Posts
Quoting malcolmb14
Disliked
I trade 100 % using vsa ....

here is what you saw and good long ... of course trend is also up on higher time frames and we have seen nothing but buying in the back ground

the dotted line is vwap , pink = point of control ( form a volume histogram for the session)


Attachment 338045
Ignored
looks good malcolmb14 I am new at understanding the VSA ways of the force, lol. I have been trading for about 3.5 years and I currently do about 12% a month under HIGH STRESS. I am really looking to reduce my stress and trade @ 25 to 30% a month

Shark
 
 
  • Post #3,777
  • Quote
  • Oct 15, 2009 11:50pm Oct 15, 2009 11:50pm
  •  malcolmb14
  • Joined Apr 2007 | Status: HARD SHYT SCUBA TRADER | 20,883 Posts
Quoting forex shark
Disliked
looks good malcolmb14 I am new at understanding the VSA ways of the force, lol. I have been trading for about 3.5 years and I currently do about 12% a month under HIGH STRESS. I am really looking to reduce my stress and trade @ 25 to 30% a month

Shark
Ignored
reduce stress ... I have an idea .. give up trading lol

vsa rocks only way to trade IMHO ....

been a 450 pip day for me scalping in and out of gj using vsa
Blogging daily now at www.volume.zone
 
 
  • Post #3,778
  • Quote
  • Oct 16, 2009 12:06am Oct 16, 2009 12:06am
  •  forex shark
  • | Joined Feb 2007 | Status: Member | 35 Posts
Quoting malcolmb14
Disliked
reduce stress ... I have an idea .. give up trading lol

vsa rocks only way to trade IMHO ....

been a 450 pip day for me scalping in and out of gj using vsa
Ignored
You mean give up and go to the stock market..LOL been there done that. I like your style malco. If you don't mind me asking, what was the volume count on those two candles from e-signal. mine where 83 & 46.

Thanks

Shark
 
 
  • Post #3,779
  • Quote
  • Edited at 8:31am Oct 16, 2009 2:29am | Edited at 8:31am
  •  tfflyer
  • | Joined Sep 2007 | Status: Member | 1,404 Posts
HiddenGap,

about stop losses - Can You say something how You take stop losses.

For example - - break of the KRB to the opposite side from You, when You are in trade, some such examples..

When You have time, maybe You can post some examples about Stop Losses..

Thank You.

Malcomb - I sent You message about Your 2 bar stop loss just wanted to get confirmation. Thanks !

Best,
Tom
 
 
  • Post #3,780
  • Quote
  • Edited at 8:32am Oct 16, 2009 2:37am | Edited at 8:32am
  •  tfflyer
  • | Joined Sep 2007 | Status: Member | 1,404 Posts
Malcomb,

how are You taking profits ?
Taking always all of the table ?
Or trailing ? Others methods..?

Maybe You can post also some examples when You have time.

Thank You.

Best,
Tom
 
 
  • Commercial Content
  • /
  • Trade Using VSA (Volume Spread Analysis)
  • Reply to Thread
    • 1 187188Page 189190191 445
    • 1 Page 189 445
0 traders viewing now
  • More
Top of Page
Forex Factory Blog Updated: Alerting All Members
  • Facebook
  • Twitter
About FF
  • Mission
  • Products
  • User Guide
  • Media Kit
  • Blog
  • Contact
FF Products
  • Forums
  • Trades
  • Calendar
  • News
  • Market
  • Brokers
  • Trade Explorer
FF Website
  • Homepage
  • Search
  • Members
  • Report a Bug
Follow FF
  • Facebook
  • Twitter

FF Sister Sites:

  • Metals Mine
  • Energy EXCH
  • Crypto Craft

Forex Factory® is a brand of Fair Economy, Inc.

Terms of Service / ©2022