• Home
  • Forums
  • Trades
  • News
  • Calendar
  • Market
  • Brokers
  • Login
  • Join
  • User/Email: Password:
  • 7:42am
Menu
  • Forums
  • Trades
  • News
  • Calendar
  • Market
  • Brokers
  • Login
  • Join
  • 7:42am
Sister Sites
  • Metals Mine
  • Energy EXCH
  • Crypto Craft

Options

Bookmark Thread

First Page First Unread Last Page Last Post

Print Thread

Similar Threads

Emacsen Study, Study, Study 0 replies

About support and resistance levels 11 replies

Support and resistance levels. 16 replies

How can I find These Values inorder to find resistance and support levels 2 replies

Possible Support and Resistance Levels 1 reply

  • Trading Journals
  • /
  • Reply to Thread
  • Subscribe
  • 3
Attachments: A study in Support/Resistance levels
Exit Attachments
Tags: A study in Support/Resistance levels
Cancel

A study in Support/Resistance levels

  • Post #1
  • Quote
  • First Post: Aug 16, 2009 1:06pm Aug 16, 2009 1:06pm
  •  Magic Trader
  • | Joined Jun 2009 | Status: undergraduate trader | 443 Posts
I'm starting this thread as a place to study and learn about Support and Resistance levels.

My trading style has been influenced by Wisdomfx and his power levels. While I don't completely understand how he comes up with his dead-on levels, I have noticed very interesting and very tradeable S/R levels.

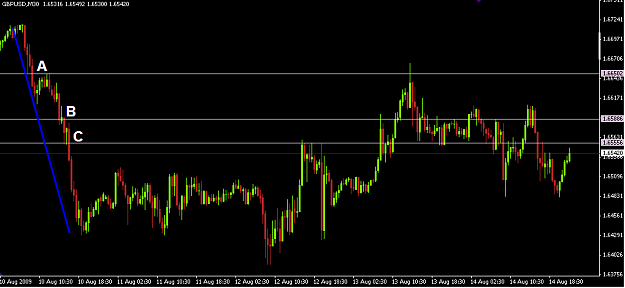
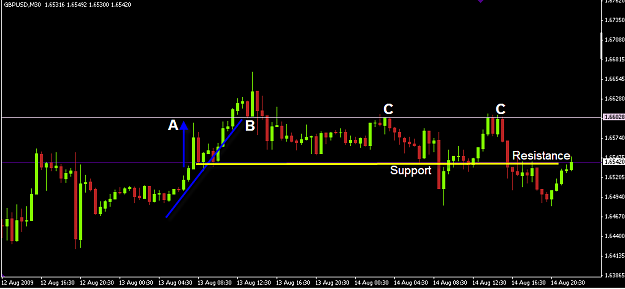
These levels are either in conjunction with, or outside of, the obvious levels. If they match up with a previous turning point, it is a great signal that level is still strong and highly likely to be tradeable the next time price reaches it.

I invite anyone to share insights in how they find and trade S/R levels. I'd like this thread to be a place to share information. I use no indicators and would like this to be an indicator-free environment. There are tons of other great threads for that discussion.

It should be mentioned, as with Wisdomfx's method, I look to take 15-20 pips per trade.
  • Post #2
  • Quote
  • Edited 1:32pm Aug 16, 2009 1:30pm | Edited 1:32pm
  •  Magic Trader
  • | Joined Jun 2009 | Status: undergraduate trader | 443 Posts
When price make a sharp move up or down, as along the blue line down, there are often places where it hesitates before resuming its move. This is exhibited either in opposite-color candles, or long shadows on candlesticks. Later, when price retraces back to these levels, it very often bounces off.

A) There are about 10 candlesticks in the area beneath A. But if you notice just to the left, there is a long lower shadow. And to the right are a pair of matching upper shadows. All three of these shadows meet almost precisely, so it's a great place for a level.

B) PA also hesitated here. I marked the level there because it was a very close place where the end of the three candle bodies met. Matching the lower shadows also would've worked.

C) The long shadows for the two left candles met exactly here. This tells me price bounced hard off these levels before making it past on the third candle. This was really a great level. On Aug 12, resistance was very strong here (it might also have been news day). And the next day it turned into solid support.

Again, taking 15-20 pips on these trades was quite safe. This method often leaves a lot of pips on the table, but it makes up for it with a high win rate.
Attached Image (click to enlarge)
Click to Enlarge

Name: 8-17-2009 1-29-49 AM.png
Size: 15 KB
 
 
  • Post #3
  • Quote
  • Aug 16, 2009 1:31pm Aug 16, 2009 1:31pm
  •  Magic Trader
  • | Joined Jun 2009 | Status: undergraduate trader | 443 Posts
Quoting biz0101
Disliked
try using rsi to locate support/resistance breakouts, i found it to be really helpful.
Ignored
Thanks. Can you post some charts if you have time?
 
 
  • Post #4
  • Quote
  • Aug 16, 2009 1:55pm Aug 16, 2009 1:55pm
  •  Magic Trader
  • | Joined Jun 2009 | Status: undergraduate trader | 443 Posts
This next chart was from the same timeframe as the other. The tradeable S/R level is the white line. Two things told me this was valid:

1) Along the blue trendline up, PA spiked at A.
2) The two candles directly above "B". The bottoms were solid bodies and both matched up.

PA bounced from this level a couple times at C.

Now along the blue trendline, price first spiked up at A. But notice that 4 of the next 5 candles had solid-body bottoms that matched up. This coincided with PA to the left of the trendline. Nothing amazing about that. In fact, if you had gone back a week or more, you would have seen this was a solid S/R line anyway.

But the point is that those 4 matching candles are telling us that the S/R line is still strong and playable. It was easily tradeable for +20 pips (where the chart says "Support) and another +20 underneath at ("Resistance"). And many more lower TF scalping as well, if that's your cup of tea.
Attached Image (click to enlarge)
Click to Enlarge

Name: 8-17-2009 1-41-33 AM.png
Size: 15 KB
 
 
  • Post #5
  • Quote
  • Aug 16, 2009 1:59pm Aug 16, 2009 1:59pm
  •  Magic Trader
  • | Joined Jun 2009 | Status: undergraduate trader | 443 Posts
Quoting biz0101
Disliked
Of course. Hope this one is understood, as I created it quickly.

Going over to 5m in the same area of price you posted (i think it's point b in your chart), you can clearly see divergence in the rsi, and the support trend line of the 2 points created by the divergence. on the third time it went to this trend line you can see it penetrated it. on most cases, you will see this in the rsi long before it actually happens on the price chart itself, giving you much better entries.
Ignored
Nice one Biz! I'll study it some more. Even if I don't trade strictly off it, I can use it to confirm what I'm seeing on the naked charts.

By the way, I assume you would have traded it at the time it was happening?

I don't show it in the chart, but my actual trades would have come later around Aug 12-13.

Please post again sometime!
 
 
  • Post #6
  • Quote
  • Aug 21, 2009 9:28am Aug 21, 2009 9:28am
  •  Magic Trader
  • | Joined Jun 2009 | Status: undergraduate trader | 443 Posts
Here is another trade I just took for +10 pips. The risk was also 10 pips. Nice action that would have gone for a +18 max.

The chart explains reasons for taking the trade.
Attached Image (click to enlarge)
Click to Enlarge

Name: 8-21-2009 10-18-50 PM.png
Size: 19 KB
 
 
  • Post #7
  • Quote
  • Sep 18, 2009 8:30pm Sep 18, 2009 8:30pm
  •  TKFOO84
  • | Joined Sep 2007 | Status: Member | 22 Posts
Waw, is that how Wisdom calculates the power level?
 
 
  • Post #8
  • Quote
  • Sep 20, 2009 3:02am Sep 20, 2009 3:02am
  •  juicyt
  • | Commercial Member | Joined May 2008 | 480 Posts
Nice idea Magic Trader for the lines. I jut eye balled some charts and that method seems pretty good.

Juicyt
"Even if you fall down face first, you still went forward."
 
 
  • Post #9
  • Quote
  • Last Post: Sep 20, 2009 3:06pm Sep 20, 2009 3:06pm
  •  Magic Trader
  • | Joined Jun 2009 | Status: undergraduate trader | 443 Posts
Quoting juicyt
Disliked
Nice idea Magic Trader for the lines. I jut eye balled some charts and that method seems pretty good.

Juicyt
Ignored
I'll post some more soon too. I've been busy recently creating S/R levels that have been good for a week. Here is an example post:

http://www.forexfactory.com/showthre...=9848&page=128.
 
 
  • Trading Journals
  • /
  • A study in Support/Resistance levels
  • Reply to Thread
0 traders viewing now
Top of Page
  • Facebook
  • Twitter
About FF
  • Mission
  • Products
  • User Guide
  • Media Kit
  • Blog
  • Contact
FF Products
  • Forums
  • Trades
  • Calendar
  • News
  • Market
  • Brokers
  • Trade Explorer
FF Website
  • Homepage
  • Search
  • Members
  • Report a Bug
Follow FF
  • Facebook
  • Twitter

FF Sister Sites:

  • Metals Mine
  • Energy EXCH
  • Crypto Craft

Forex Factory® is a brand of Fair Economy, Inc.

Terms of Service / ©2023