Hello folks,
I decided to start this thread for one simple reason. I would like nothing more than an honest to goodness explanation,the 'why' if you will.
Having spent the past several months live trading this 'anomaly' with varying techniques on various time frames, all have been successful, some more than others.
The majority of my trading time and earned pips with this indi. were in the higher volatility pairs including gbp and gbp crosses.
Over the course of the past several months I've made some refinements to my own personal R:R scheme before entering the spot FX market. If anyone chooses to incorporate this indi. into their trading, a good R:R scheme should be your cornerstone.
I do not want to propose any type of stern trading technique here.
Just an outline of how I use this indicator in general and hopefully get a solid answer as to the 'why' question.
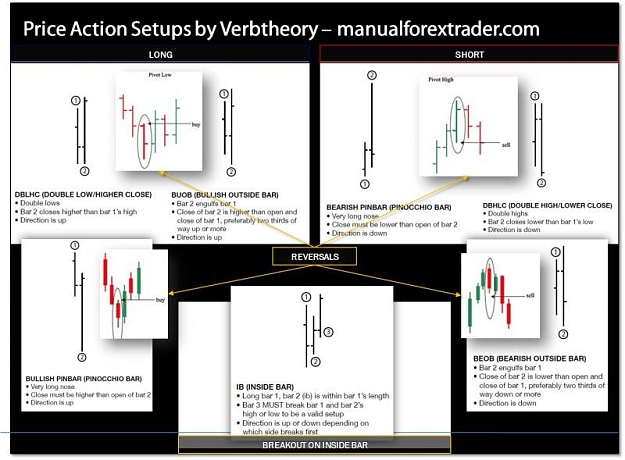
The price action indicator was originally coded by Victor M.(thank you),
to help identify 'market structure'.
The Scalper candle signals was originally coded by SwingMan(thank you), to help identify cycle.
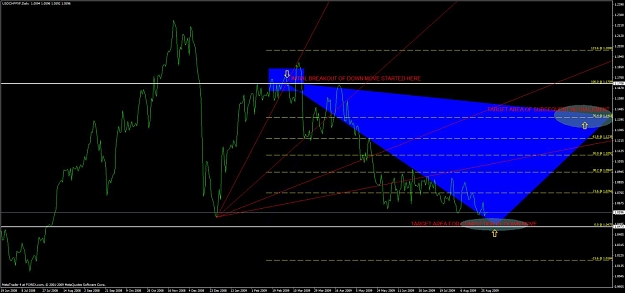
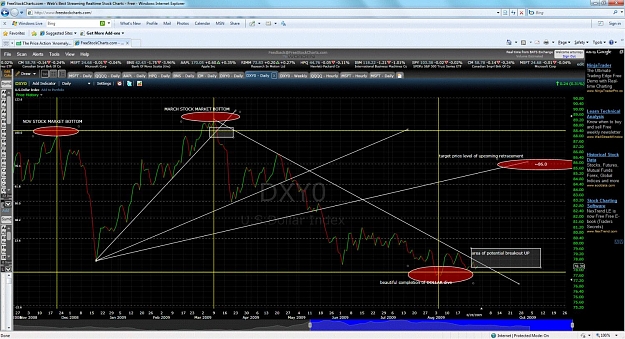
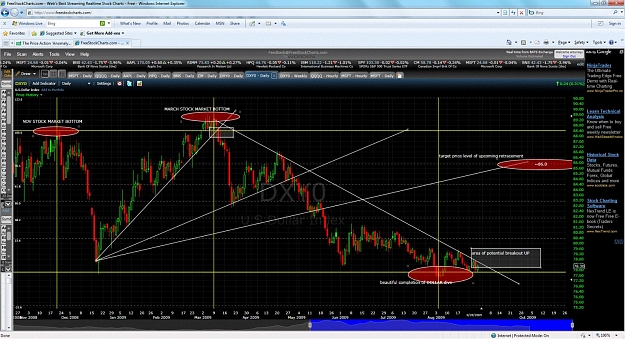
Trading the VM Price Action anomaly.
1)BuOVB( Bullish outside vertical bar)
BeOVB (Bearish Outside vertical Bar)
The original indicator marks them as 'red stars'.
2)Along with Swingman's Scalper Signals to identify general direction.
Very simple, Mark the un-filled vertical bars(gaps) and target them with SMC4 Scalper Signals, off anytime time frame.
Regards to all and happy trading!
I decided to start this thread for one simple reason. I would like nothing more than an honest to goodness explanation,the 'why' if you will.
Having spent the past several months live trading this 'anomaly' with varying techniques on various time frames, all have been successful, some more than others.
The majority of my trading time and earned pips with this indi. were in the higher volatility pairs including gbp and gbp crosses.
Over the course of the past several months I've made some refinements to my own personal R:R scheme before entering the spot FX market. If anyone chooses to incorporate this indi. into their trading, a good R:R scheme should be your cornerstone.
I do not want to propose any type of stern trading technique here.
Just an outline of how I use this indicator in general and hopefully get a solid answer as to the 'why' question.
The price action indicator was originally coded by Victor M.(thank you),
to help identify 'market structure'.
The Scalper candle signals was originally coded by SwingMan(thank you), to help identify cycle.
Trading the VM Price Action anomaly.
1)BuOVB( Bullish outside vertical bar)
BeOVB (Bearish Outside vertical Bar)
The original indicator marks them as 'red stars'.
2)Along with Swingman's Scalper Signals to identify general direction.
Very simple, Mark the un-filled vertical bars(gaps) and target them with SMC4 Scalper Signals, off anytime time frame.
Regards to all and happy trading!
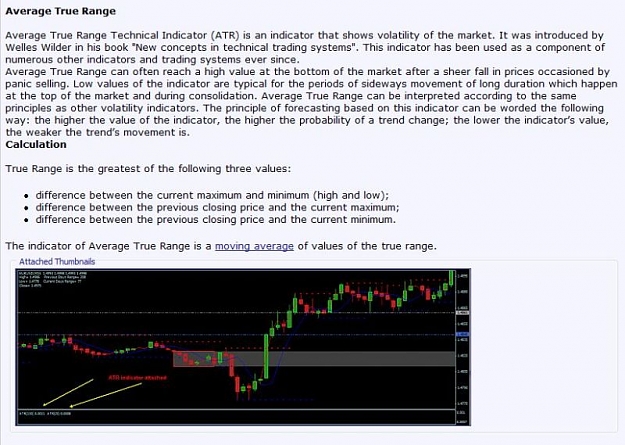
Attached File(s)