Hope you find some value in this.
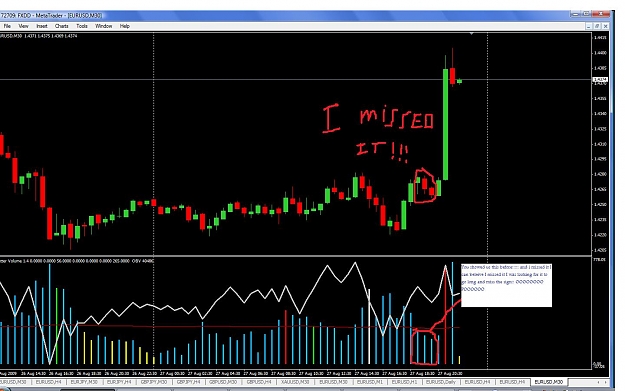
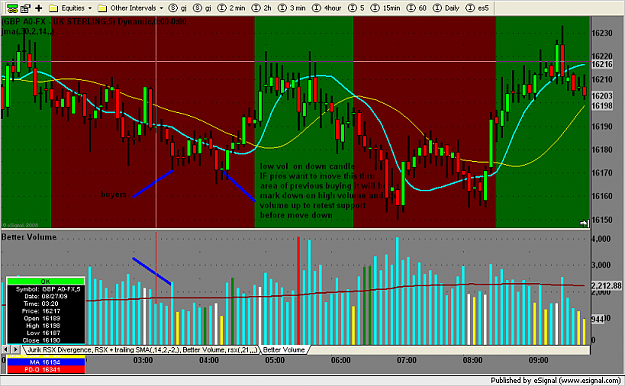
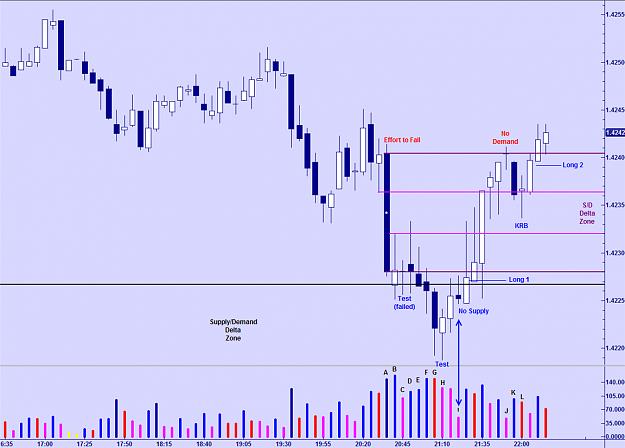
Interesting set up in the Euro/USD on the 5 min.
A: Effort to Fall candle. Wide spread down candle on climatic volume that closes slightly off its low with the next candle up. Some Demand (buying) is hidden in this candle. Why else would the next candle be up? However, the sellers were in charge on this interval.
B: Up candle showing that there was some buying on the first candle. Notice that the range is narrower than the first candle and the volume is higher. This is a squat. Also note that the close is in the lower portion of the candle. This is bearish. The long upper shadow shows supply entering this candle as well. Is the supply/demand imbalance on the side of supply or demand? We don't know. So what do we do?
C: We test. Narrow range down candle closing in the upper 1/3 of its range on volume less than the previous two candles. So we have tested. But we need it confirmed.
D: Equal close to the test bar, with a long upper shadow showing some more supply. The candle does not make a lower low and volume increases.
E: This candle is down and closing lower than the close of the test. Our test has failed. We have now seen a candle closing lower on increasing volume after our test. Our test has failed.
F: Down candle on increasing volume, but the close is roughly in the middle of the range. There is buying (demand) on this bar.
G: Down candle on equal volume that again closes off its lows. Here again this candle makes a lower low, but demand steps in and pushes the close off the low. Ultimately we have a down candle on high volume. Generally speaking, increasing volume on down candles is bearish.
Since our test (failed) candle, we have seen 3 candles with lower shadows. In other words, although they have closed lower, they have closed off the lows as volume increased. There had been some buying in them.
H: This is a test. To Japanese candlestick traders this is a hammer. From a VSA perspective. This is a candle on volume less than the previous two candles that makes a lower low but closes higher than the previous candle and in the upper 1/3 of its range. Prices were marked down to look for supply and none was found. If there had been supply in the market, the volume should be higher and the close should be lower in the range.
I: This is a key bar. Note that this is a down candle. We close lower than the previous bar. Since the previous candle was up, our test is confirmed. More confirmation comes here. There is no volume on this down candle. Notice the amount of volume on all the down candles since the first test (failed). Volume on down candles had been increasing or equal, now it is dried up. The supply is gone.
We also note that the next candle is engulfing this down candle. Long at the close of this candle.
J: As the market moves up, we see a narrow range doji on volume less than the previous two candles at the edge of the supply/demand zone. If we look back to the Effort to Fall candle, we see that in the price area where it began and brought in ultra high volume, we are now seeing no volume. Simply, sellers rushed into the market in this area, but are not rushing in to sell again. The BBs are not very active on this bar, just in case.
K: Down candle on increasing volume. One last ditch effort for the sellers to regain control of the market.
L: This is a key reversal candle. The open of the candle is higher than the close of the previous candle and the close is higher than the open and the close of the previous candle. The low is lower than the previous candle, yet the close is in the upper portion of the range. This is not quite a doji but pretty close.
If you viewed this as a test candle, then the volume is not less than the previous two candles and is a bit high. However, this candle is ultimately bullish. Again we see the next candle engulfing and closing up. Another chance to enter or add-on.
I know this is not what most people here want, but I believe there is some value in this chart. Hope it helps. FWIW current price is 1.4250.
Attached Image (click to enlarge)
Without VSA, you're playing checkers while the Smart Money plays chess.
2