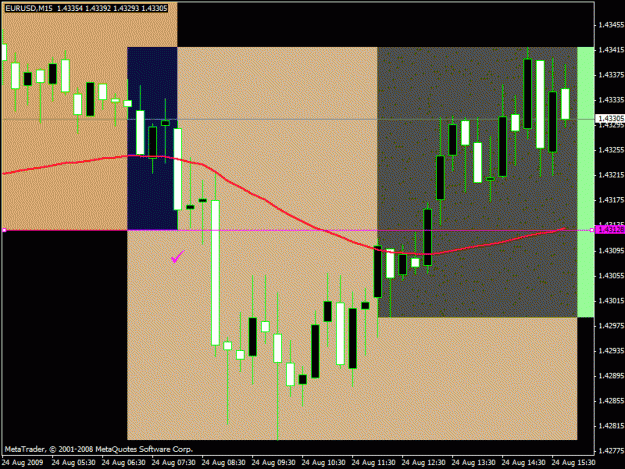
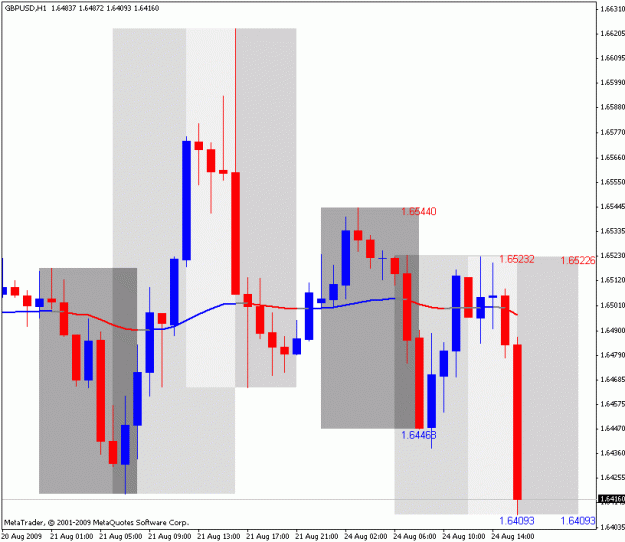
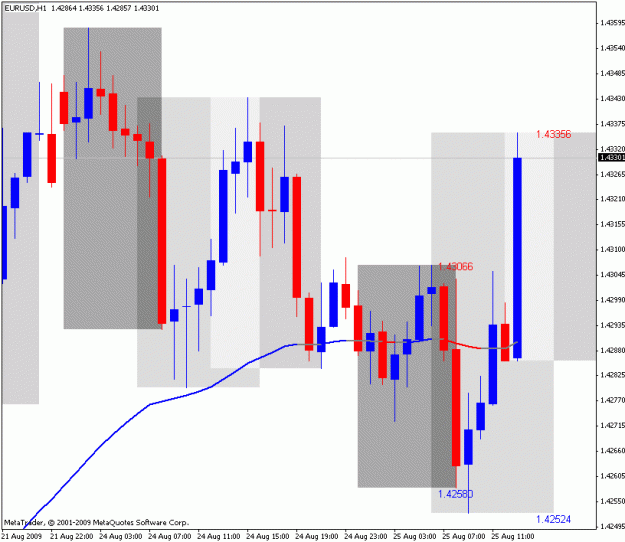
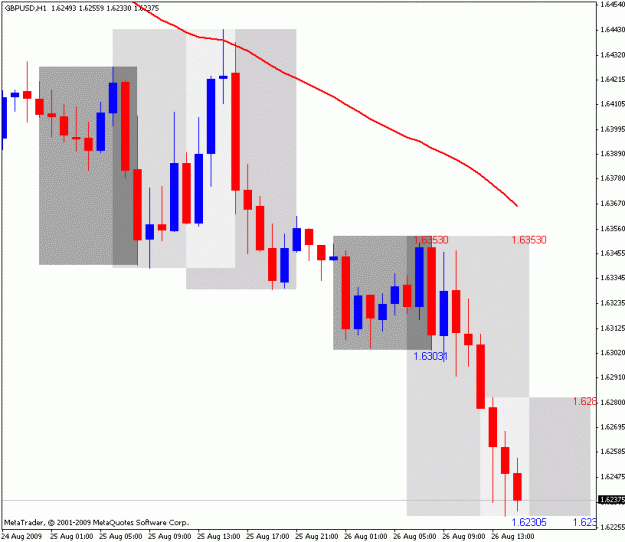
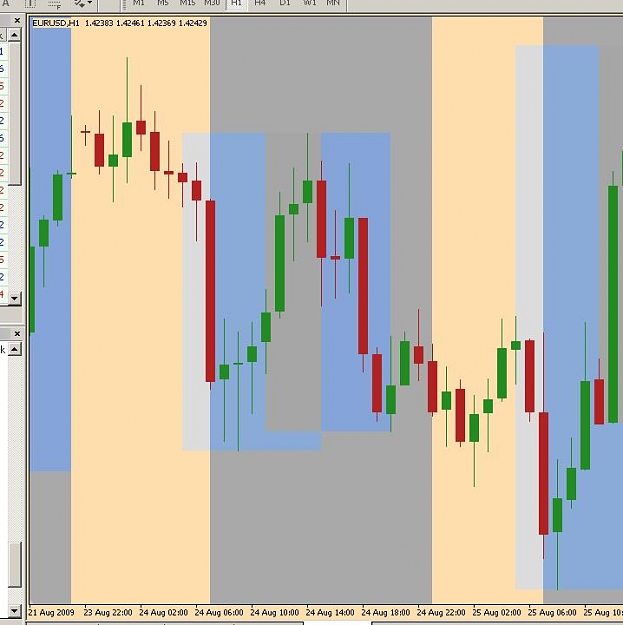
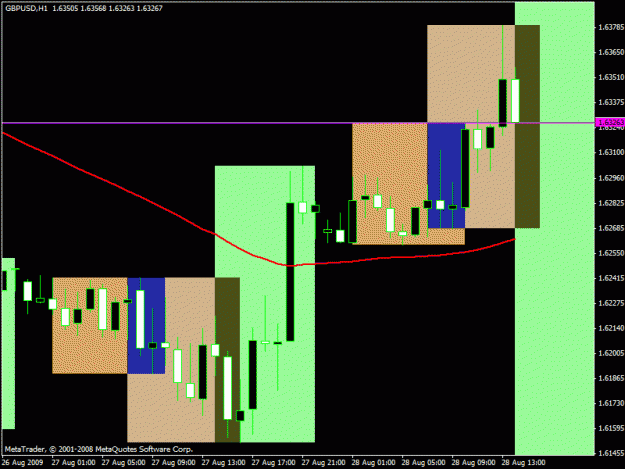
Attached Image (click to enlarge)
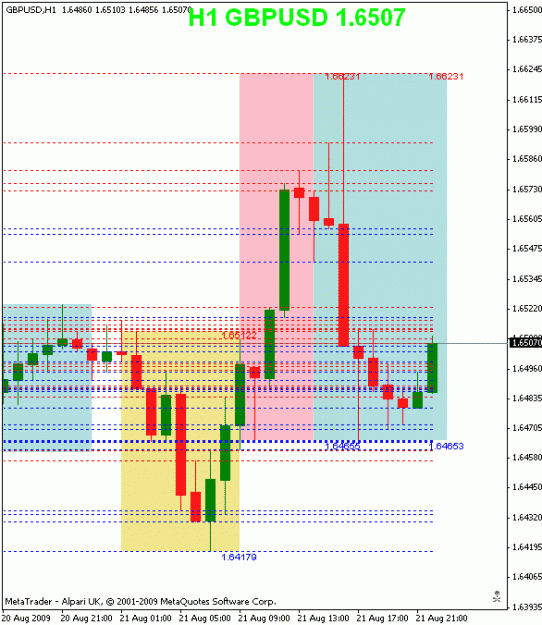
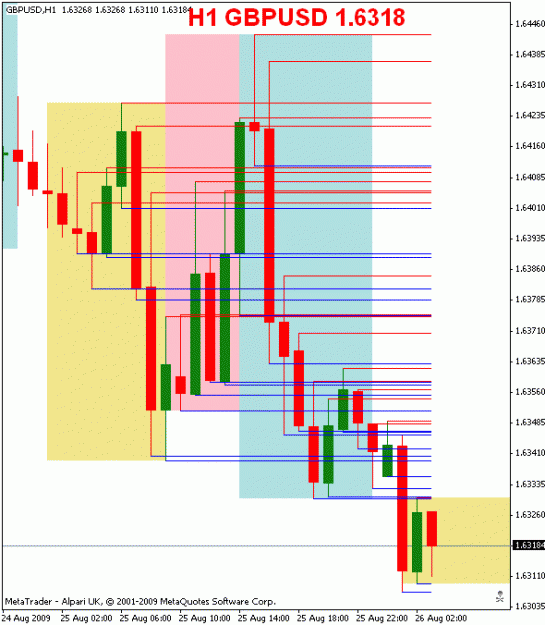
FrankenPip gave me an idea this time. Show the high and low for the last 24 hours. Then you can see all of the "breakouts". Lots of red or blue close together would indicate strong support/resistance, don't you think?
I will consider starting a thread on this unless it has been done already.