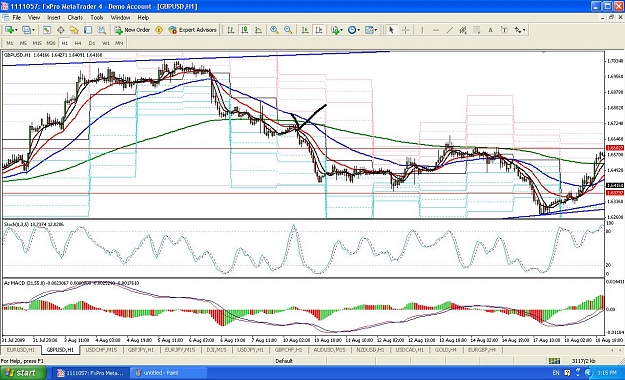
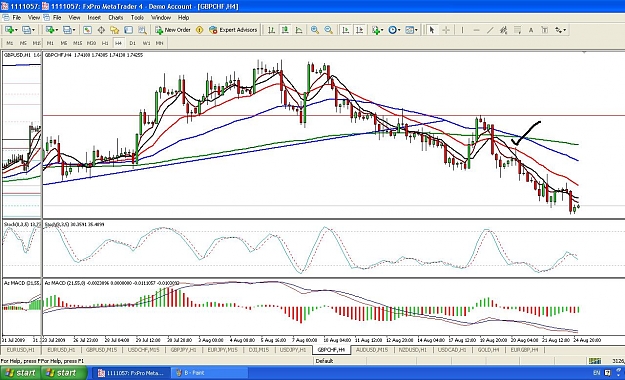
- Draw trendlines and horizontal lines as you see fit
- Identify basic price movement and form a bias: long, short, or range?
- Once you have a bias, look for a signal
- The 21/55 EMAs have to have split after consolidation, or be at a point where they are about to cross the 200 EMA
- Once the first wave is complete(in which price would have crossed the 200EMA, and the 21 or 55 at least touching it), wait for price to retrace
- Draw a fib - a fib level overlapping with the EMAs is good
- Draw a horizontal line where the EMA and fib overlap. Zoom out and see if that level was previously strong support or resistance.
- If it is, JUMP IN!
- Set your target using common support and resistance levels such as trendlines or higher time-frame 200 EMAs
For more, check out http://gulzaarfx.blogspot.com