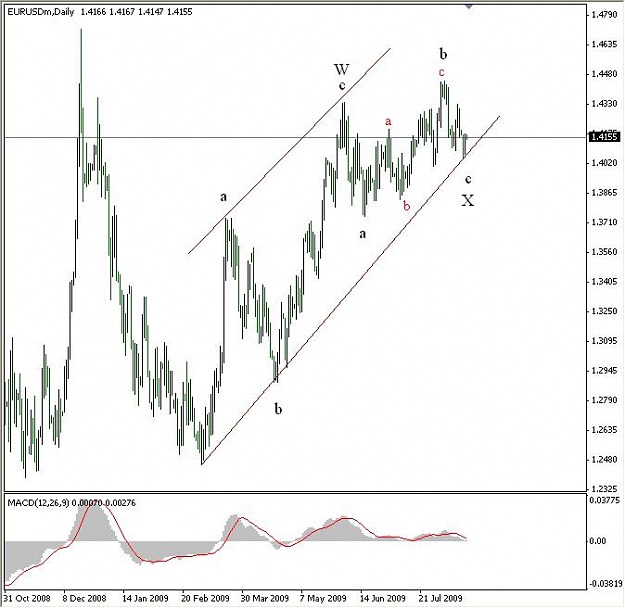
Price continues to be in the area of bifurcation, but yesterday swung against the American dollar. Perhaps she had already made her choice, but there is no confirmation for any scenario considered.
In such an uncertain situation, better to go along with the price and play from the borders of trend channels to clarify the wave picture.
how do you know that c is not already there on the chart; i can clearly see an a-b-c correction?
why would c = a? the ew cheat sheet for a zigzag correction only says that wC > 0.7*wB and i do not even trust that, almost anything can happen during corrections
i find it very risky to trade against the main pattern, on your chart a down IM. suppose you count is not correct, meaning that correction is already complete, what would save your longs in that case?
well, it might be a good trade after all, who knows ;-)
how do you know that c is not already there on the chart; i can clearly see an a-b-c correction?
why would c = a? the ew cheat sheet for a zigzag correction only says that wC > 0.7*wB and i do not even trust that, almost anything can happen during corrections
i find it very risky to trade against the main pattern, on your chart a down IM. suppose you count is not correct, meaning that correction is already complete, what would save your longs in that case?
well, it might be a good trade after all,...
Ignored
My view point is that Wave A was 5 up, so that would mean a 5-3-5 correction. If that is the case, it is quite common for wave C to equal wave A.
As always, if you can't see it, don't trust it, or don't like it -- DON'T trade it. I trade what I see.
Trading against a trend is inherently more risky, but I had a wonderful entry point with very little risk...so I took it.
If you Following the Harmonic Rule:-Point C is generally the weak link in the pattern. The retracement of A-B to point C could form at any fib ratio, right from 0.382 to 0.886.
Point D is the ultimate confirmation point of a harmonic pattern. ‘D’ will always form at a confluence of 2 fib levels (depending on the type of pattern) and these fib levels are very accurate. The 2 fib ratios (the Retracement of X-A AND the Projection of B-C) form precisely at the expected levels.
as I have seen already .. so The Impulsive 12345 count we can see soon in Usd/chf...
Little confused Sir I am Just Thinking The Usd Is the weakest Currency Among The All Pair..
And Where The USD is Strong some Countries the Government Want that The USD to be Strengthen With There Currency .
I just have a Past news Of The Singapore and India are the Two Country Those Has the Higherest Rate Of Job Claim thats why they Doesn't want the USD Gonna be Weak.. So they Just Playing particularly To maintain The Back Power to Put the USD Hight to Give Job More with There workers!!!, But On Thursday USD Gross Domestic Product (Annualized) (2Q P) are Good Expectation!!
so I Just Mean Do you think The Current Count Follow On With This Effect Of Just has a Little zigzag and Thats it...
I dont Know Sir you Believe in Delta Thoughts,but it is Bullish with his Next SLTD of the 1.48 .. I mean It Will Continue
Here is my current EW count on GBP/USD, and I'm watching the 1.6417 level as well as the 1.6542 level. A break of either of these levels will confirm a count in one direction or the other.
Here is my current EW count on GBP/USD, and I'm watching the 1.6417 level as well as the 1.6542 level. A break of either of these levels will confirm a count in one direction or the other.
More and more the GBP/USD is looking to be bullish (since there is not much momentum to the downside). We'll have to see if the (i), (ii) count is correct or not. If so, we can start to look at the 61.8% fib as a possible top to blue wave ii.
I'm long at 1.6450 with a few pips in my pocket tonight, so I can't lose anything now....We'll see where it takes us.