Watching my 15 min charts I've just seen that the low so far is in the candle that has just closed, the low was at the 6350 level with a very high volume red doji.......will this hold or will the 6335 / 6300 support area get tested?.....TWT......
Watching my 15 min charts I've just seen that the low so far is in the candle that has just closed, the low was at the 6350 level with a very high volume red doji.......will this hold or will the 6335 / 6300 support area get tested?.....TWT......
Ignored
So far the 635 support area has held and I took a small contra trend buy and exited at the S3 level which is now resistance
The 15 min candle that is closing as I type is another high vol red doji which I again read as being profit taking and / or buying....
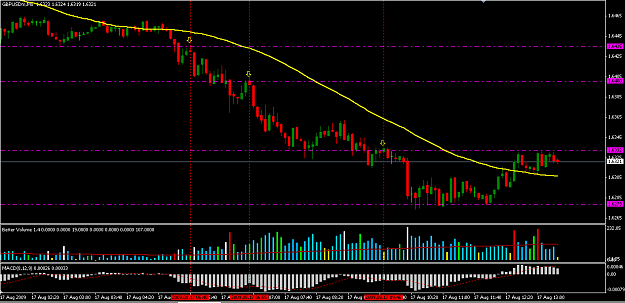
NP - # 1 was my sell signal, #2 the first high vol candle with a downside wick - a hammer #3 a very high vol doji #4 another doji with high vol...
I've closed all of my shorts and am taking small hit and run buys whilst waiting for a pull back to the aqua (13) ema / 6400 area where I'll consider another short. Until price stays above the 13 ema AND that ema reverses its slope to upwards the short term trend is down....
Could You please tell why You tooked first short - was it based on VSA ?
Thanks.
b,
Tom
Ignored
No, not a VSA trade, the volumes were - as is often the case - low during the Asian Session.....as soon as I got to my 'puter at around 5:10 gmt I noticed the Lower Highs, so it was a low risk Sell entry.
I then watched the earlier lows ~ the 6435 area that cable likes and when they broke I just traded the Sweet Spots and Pivots down until the long wicks appeared and the volume picked up.
I then watched the earlier lows ~ the 6435 area that cable likes and when they broke I just traded the Sweet Spots and Pivots down until the long wicks appeared and the volume picked up.
Hey Islander
Took the same sell as your 2nd entry (6434). Wasnt up early enough for the 1st one
It looks like GU has made its move for the London morning session. You are right best to take a break and come back later, otherwise you loose concentration get bored and start looking for trades.
Hey Islander
Took the same sell as your 2nd entry (6434). Wasnt up early enough for the 1st one
It looks like GU has made its move for the London morning session. You are right best to take a break and come back later, otherwise you loose concentration get bored and start looking for trades.
I think we have fairly similar styles. Where you used Sweet spots and Pysch zones I use S&R lines drawn from the 1H timeframe. They seem to be in similar areas.
I posted before on how I trade using S&R in conjunction with VSA (and on occasion MP) to find high probability set ups.
IMO the key word is AREAS.....I'm always looking at the Price Action in the area of the SS / Pivots.....when VSA shows up with the appropriate PA - i.e. Candle - it helps show what the Big Dogs are doing and can help us to position ourselves in line with their actions - well that's the theory.....
I think we have fairly similar styles. Where you used Sweet spots and Pysch zones I use S&R lines drawn from the 1H timeframe. They seem to be in similar areas.
I posted before on how I trade using S&R in conjunction with VSA (and on occasion MP) to find high probability set ups.
Hey guys I do not have charts for the DOW. I was curious as to what the DOW was doing in relation to VSA. Could someone Please post a Daily chart for the DOW it has droped a 180 + points today and i hear support is at around 9200 so if we get a close below that we could be in for a pretty big fall. Thanks in advance.....