Hi everyone
I am a trader of the S&P emini and have dabbled with FX trading in the past and recently started trading EU and GU applying the methodologies I use in my S&P emini trading. Why not just stick with the emini you ask? I am in the UK and the main trading session does not start till 2:30pm, I do trade the pre market but it can be very slow, so to fulfil my itch to trade I have reignited the FX fire.
What will be the philosophy and focus of this thread? Many traders believe that to be successful you need mountains of indicators that give you some kind of "edge" over the market. I am here to say that trading as a means of consistent income does not have to be painful or difficult. That less is certainly more when it comes to trading. Ive met traders with every indicator under the sun on their charts, with years of training under their belts having spent thousands of $$$'s and STILL not making a consistent income....
Why? Because Indicators are liars! Sure sometimes you might pull of a trade or 2 but in the end you always get spanked....Why? Because not everyone uses a MACD with your settings, not everyone uses a Stochastics or an RSI. I believe to be an effective trader you have to look at what the majority of traders look at...So what do most traders look at? Support and Resistance! Almost every system out there uses Support and Resistance to some extent. Support and Resistance is our number 1 indicator. So why not make Support and Resistance your system?! Mark up some levels on a chart using time frames from 1hr and above (this is what the big boys who move the market watch, so no lower please) and see what happens! Use other info that the majority of traders watch ONLY as confluence, Market Profile levels, Pivots and Fibs.
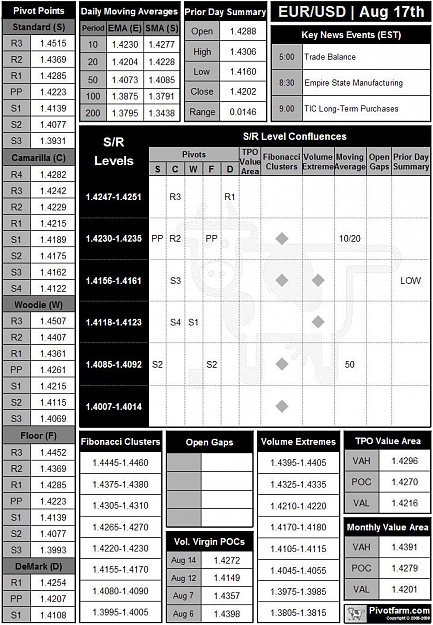
Starting on Monday I will post my daily trade prep sheet listing the key Support and Resistance levels I will be watching and confluences for those levels. In many instances historically referenced Support and Resistance levels can help traders catch markets tops/ bottoms to the very pip! Why? Because Support and Resistance levels are the most widely used trading tool! Everyone from Hedge funds and banks to the small time trader at home use Support and Resistance levels
It might be difficult to leave the system you are using now so why not use these levels as a guide alongside set ups defined by the system/strategy that you are implementing. All levels described have historical significance and are thus considered high probability numbers. The numbers described are in a fairly large range to take account of market volatility. Throughout the trading day these numbers can become areas of Support AND Resistance.
I am not saying I have all the answers but working together I am sure we can find a method that works
