Yup. It's an unavoidable problem with placing 2 charts on top of each other. The best solution is to try to standardize your charts so they zero out at a specific point in time. Maybe a 0:00 5 Day and a 0:00 20 Day etc. It's not an easy fix but that's the reason they shift. Just print out 2 charts and overlay them and you'll see that the crosses change depending on how you position them.
That's why a chart that displays the spread is really the only true indicator of where the 2 pairs are in relation to each other. The overlayed charts just give you a visual indicator of what they've been doing which is important but the spread is king.
I'm able to zero out my brokers charts but MT4 needs a good indicator that will zero out two overlayed charts and not just overlay them. So far I've never seen any way to do it with MT4.
Warning though, even when you zero them out the crosses and gaps will still change on you. It all depends on the beginning time you zero out.
Yup. It's an unavoidable problem with placing 2 charts on top of each other. The best solution is to try to standardize your charts so they zero out at a specific point in time. Maybe a 0:00 5 Day and a 0:00 20 Day etc. It's not an easy fix but that's the reason they shift. Just print out 2 charts and overlay them and you'll see that the crosses change depending on how you position them.
That's why a chart that displays the spread is really the only true indicator of where the 2 pairs are in relation to each other. The overlayed charts just give...
Ignored
So back to Post # 1, since the charts are going to be inversed depending on how you view them, then I guess it makes sense to just throw out a position and then when the charts inverse again your in the green...just have to wait...makes sense no? So really there is no science to this madness...just profits, eventually, hopefully, so long as you can withstand the possible blood bath...
I'm very sorry for being such a noob sometimes (alright, alright - pretty always), but could you explain how to trade with your indicators & template. Just for the sake of clarity.
Thank you.
P.S.
Great job with this template and indicators, we owe you one.
So back to Post # 1, since the charts are going to be inversed depending on how you view them, then I guess it makes sense to just throw out a position and then when the charts inverse again your in the green...just have to wait...makes sense no? So really there is no science to this madness...just profits, eventually, hopefully, so long as you can withstand the possible blood bath...
Ignored
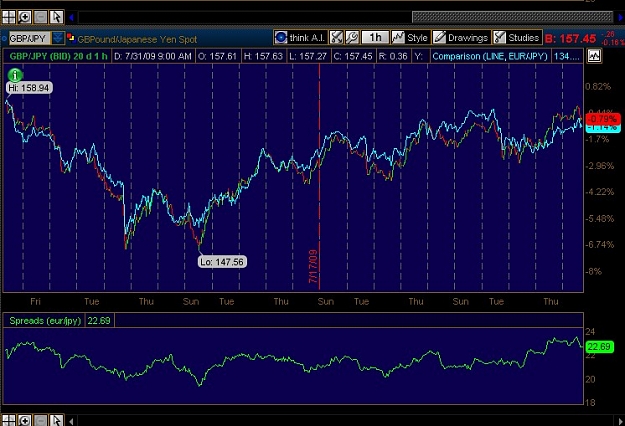
Hopefully when you throw out a trade the spread is either over-bought or over-sold depending on which way you want it to go. For example, this chart shows the G/J vs E/J. You can see the spread between them is on the high end so the odds are that the spread will narrow. Maybe yes...maybe no but I'm just looking at the probability of something happening. What is the probability? Good question. I'm not a science or math teacher so I'll leave that to the number crunchers. It would be fun to know what those odds really are. Now that would be a helpful tool. Any math whizzes with coding skills around?
I have attached all trades for this week. I took a total of 12 trades, all 12 have closed out profitably, with a total gain of 649 pips on live accounts. This would be an average of 2600 pips a month if I were to continue trading like this, assuming every week was like this one.
However, I have an announcement to make, and that is that I am stopping trading this method live, and would recommend everyone to do the same. The reason for this is because of some very well stated objections by people in this forum, showing that at times the markets will trend strongly. If I traded this method as I have this past week, in a highly trending market I would be wiped out.
We must find a way to keep this from happening. Possibly with the new indicator posted here there may be some advantage we can gain by using it. I don't know.
Obviously you are free to do as you see best in your trading, I am only being honest here and recommending that nobody trade this live anymore until we discover ways to deal with trending markets and protect our accounts from getting margin called. Integrity requires us to make an honest assessment of what would happen not only in good times but in bad, and I do not believe this method would stand up in "bad" (for this method) markets.
By the way, on the attached trade results I have done all the addition manually, by hand, so if there are any errors please let me know and I'll correct them.
Thank you to all who have contributed to this thread.
I have attached all trades for this week. I took a total of 12 trades, all 12 have closed out profitably, with a total gain of 649 pips on live accounts. This would be an average of 2600 pips a month if I were to continue trading like this, assuming every week was like this one.
However, I have an announcement to make, and that is that I am stopping trading this method live, and would recommend everyone to do the same. The reason for this is because of some very well stated objections by people in this forum, showing that at times...
Ignored
Very well stated. Nobody should be trading anything live without fully understanding the risks involved with margin calls. That's what demo accounts are for. I look at this "method" of trading more about education than any type of sure fire way to get rich. I think that a picture can be worth a lot and that's what my goal is with this. Trying to find a "picture" of the market that is useful to me in my trading. Just trying to look at it with a different telescope to see if there's anything of value.
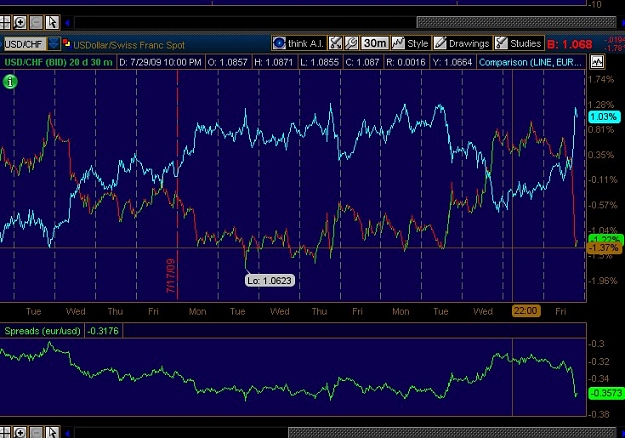
This chart shows you how quickly you can win or lose with this or any method. As I sit here the spread has just widened to about .36 from .32 in just a matter of minutes. Luckily I was on the right side for a short time and captured some pips. Not nearly as many as I wish but that's ok. Now you can see the spread is just turning back and that it's in an extreme level vs the past 20 days. Watching the spread isn't much different than just watching the price action of one pair. It just puts a different twist to it. I also think playing with the charts give you a better understanding of how all currencies are related and interact. It's helped me understand it more.
Keep demoing and experimenting. That's what makes it fun and above all...protect your assets!
Its the way like that charts are drawn, i dont know what companie´s charts are that, but dailyfx.com what have been shown here in this thread are doing same, and problem is that there are no fixed scale. so you cant say which cross is above and which below cause you need to have fixed vertical scale, and that is e/u vs u/ch and once you will have fixed vertical scale keep in mind that 1 pip of e/u is not same value like u/ch but i cant see it was not mentioned here previously so looks like noone of you care about different values so forget that
Very well stated. Nobody should be trading anything live without fully understanding the risks involved with margin calls. That's what demo accounts are for. I look at this "method" of trading more about education than any type of sure fire way to get rich. I think that a picture can be worth a lot and that's what my goal is with this. Trying to find a "picture" of the market that is useful to me in my trading. Just trying to look at it with a different telescope to see if there's anything of value.
This chart shows you how quickly you can...
Ignored
Maybe we were looking at this not quite the right way. I think your chart tells all. I think the rules have to be fine tuned, for instance, only trading highly correlated pairs >85% on Mataf.net tables and looking at the spread and determining the support and resistance of the spread, and then just opening positions as discussed in Post #1. I do not think strong, long trends have any adverse effects on the success of this "method." Since they are correctlated highly, even if there is a strong trend, the two pairs will continue to travel together, both going up and down slightly, and the spread will have its deviations along the way too. I think to determine whether to go long or short a particular pair you need the chart above and have to go by the spread window. However if you look at the GU/EG combo over the last 4 days, 4 days ago the dailt correlation was at -79.9%, now it is -%57.4. This is lower % hurts our rate, probability, and speed of return.
I have just started trading from an office off successful Spread traders. They trade using TT software and enter the actual market with no broker Spread. Anyway from the few months I've been their I'm learning that monitoring and intimately getting to know the Spread you are trading - so you know it without looking at a chart is part of their winning mentality. I'm not saying the charts don't help, they help me understand what's actually going on but it's knowing how the spread moves on a daily basis and then any underlying patterns to it. It's also being aware of open and closing prices of the individual legs and being aware of news in the real time being careful and welcoming major announcements as the can help a winning position.
With spread trading you are liable to go offside more than you are onside so it's important not to over extend and have a stop limit. Some of the big traders the office can hold onto a losing position for days/ weeks so it can boils down to how deep your pockets are... And yes they get smashed up once in a while from big moves. If you build your account by using careful MM, start very small so if a big move happens it wont effect your ability to trade.
I think it's might be worth just following one spread, get to know it, see how news effects it, watch it when it reaches a support and resistance level etc. - be an expert at it.
Oh one important thing I missed- averaging yes they do it and one colleague actually hopes his first two positions go against him so he can work others. They are true professional traders and make serious money using spreads so it can be a winning formula, let's keep learning....
I have attached all trades for this week. I took a total of 12 trades, all 12 have closed out profitably, with a total gain of 649 pips on live accounts. This would be an average of 2600 pips a month if I were to continue trading like this, assuming every week was like this one.
However, I have an announcement to make, and that is that I am stopping trading this method live, and would recommend everyone to do the same. The reason for this is because of some very well stated objections by people in this forum, showing that at...
I have just started trading from an office off successful Spread traders. They trade using TT software and enter the actual market with no broker Spread.
...
Regards
Red
Ignored
Interesting. Keep us informed of what they're doing. What pairs are they using? What are they looking at and how are they playing them? I agree with just watching one or two pairs and learning how they move and react. Your success will be much better if you know what you're trading.
I can't make the new indicator work; everything is just showing 0. Any idea how to make it work?
Ignored
Is your broker a 5 digit broker? My broker is 4 digits so I haven't tested on a 5 digit broker, but it wouldn't surprise me if that screws up the math.
If that's not it, I have no idea why it wouldn't work.
Walk me thru step by step what you did with them once you downloaded them and I'll let you know if anything looks amiss...
I'm very sorry for being such a noob sometimes (alright, alright - pretty always), but could you explain how to trade with your indicators & template. Just for the sake of clarity.
Thank you.
P.S.
Great job with this template and indicators, we owe you one.
Ignored
Hi Lawrence,
How to trade with them is sort of up to you
I was thinking that you could wait for the gap to open to the normal historical maximum, and then enter...Which might work, or it might continue to grow larger. I think a safer method might be instead to wait for the gap to close and reverse, and then get in on the wideing gap, rather than the closing gap.
I dunno...Needs more looking at.