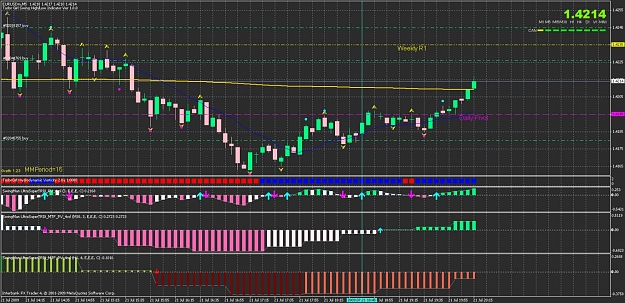
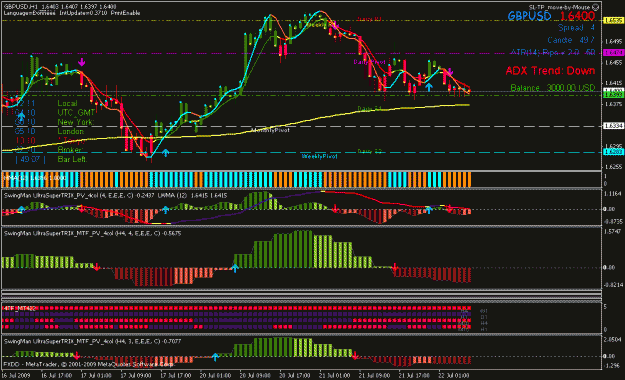
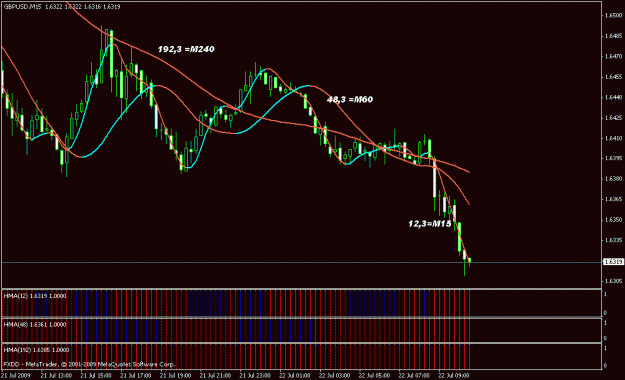
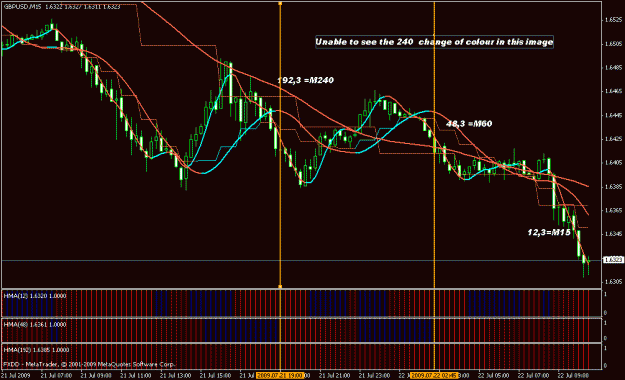
DislikedI'm not following you. I see a line on your chart that looks like stairs. What line is that for? I see a second line that is wavy. I assume that's the 12 LWMA? Where are the other TWO LWMAs. (you said there were three of them)Ignored
All are 12,3,6 LWMAs - white is M15, blue is H1, yellow is H4. That is how they look if brought to lower timeframe.