I noticed that adaptive RSI is nearly identical to the LWMA(12) we were using with C4, so if I changed MTF_MegaTrend_Bar_4TFNextM9 input settings to a 12 MA period wouldn't that be just like having a MTF Adaptive RSI signal bar indicator too?
Ignored
Think my question to you got a little buried in the thread.
I didn't get a lot of time in last week to trade C4 style during the hrs Edge recommends, so was wondering if anyone knows if there's a way or if it's even possible to manually enter a trade/s via EA, script file etc, and for it to show up in the results tab of MT4's Strategy Tester?
Think my question to you got a little buried in the thread.
Ignored
Was this a question for me? I don't know and don't use this indicators. I developed indicators in this thread only to better visualize and understand Edge's ideas. For other developements have I unfortunately not the necessary time.
Was this a question for me? I don't know and don't use this indicators. I developed indicators in this thread only to better visualize and understand Edge's ideas. For other developements have I unfortunately not the necessary time.
So I have added a little extra feature to be able to set the start and stop times of opening trades. I plan to run from 0600-1000GMT and then from 1200-1600GMT.
Anne
Ignored
Anne,
Hope you had a nice trip.
A useful feature for the EA would be a day function (i.e. flag which days to trade, for example no trading on Fridays, etc.)
Kostas1
P.S. Not to brag here but being a PhD scientist myself, it doesn't really help in trading. Trading is a great equilizer....
Jacson, is the target where the star is, or the low of the candle if the price is above it at the time/high of the candle if it's below?
What is the meaning of a gold candle?
Is there a thread or write up on this indicator?
Jacson, is the target where the star is, or the low of the candle if the price is above it at the time/high of the candle if it's below?
What is the meaning of a gold candle?
Is there a thread or write up on this indicator?
Ignored
Hey,
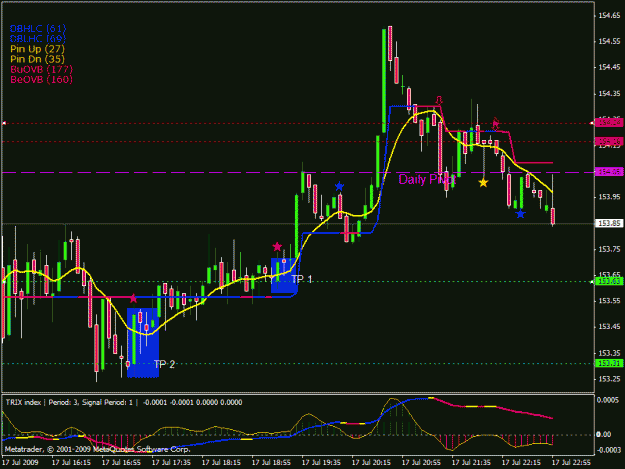
Attached chart.. 5min "superfly" also known as Sterling/Yen.
I've highlighted my TP's... 2 of them...notice how price oscillated above both Red Stars, not below yet...
That's Price in real action.
-A decision was made to take price parabolic for the day.
If price oscillated below the Red Stars and closed, I would not of used these areas as targets.
Now granted price can go significantly further down( which I suspect will happen at some point...)
But as a C4 Scalper using Edge rules, I don't want to hold this position for a swing perhaps.
Gold stars are PIN Bars, technically where buyers have met sellers and vice versa, in enough quantity to force a price "barrier".
"Right?" No, -WRONG. 500 "count bars" setting means how many bars back(history) will be shown..
(500 bars for Trix is approx 30+ hours of previous data)
Scroll your chart from right to the left.. SEE? And if you'd like to see more
than that, you can change it to perhaps 1000 and it will show ( paint ) more previous
data as far back as 1000 bars... Capisc? But higher Number you choose, more Computer resources will be used.
Ignored
Thanks for the info...I see what you mean...Thanks for the help..
Was this a question for me? I don't know and don't use this indicators. I developed indicators in this thread only to better visualize and understand Edge's ideas. For other developements have I unfortunately not the necessary time.
Ignored
No problem, no development needed, it was just a question.
Thanks for all your hard work towards the C4 thread, and for further developing the Super Trix indicators. I'm back-testing your MTF Trix in 5 min to 1hr and don't think I've ever gotten sense of seeing the immediate future with any other indicator like this before, amazing job!
I seriously doubt anyone will be able to proof up another indicator that can do a better than it can.
If anyone can figure out NASA's problem, I bet it's you.
Attached chart.. 5min "superfly" also known as Sterling/Yen.
I've highlighted my TP's... 2 of them...notice how price oscillated above both Red Stars, not below yet...
That's Price in real action.
-A decision was made to take price parabolic for the day.
If price oscillated below the Red Stars and closed, I would not of used these areas as targets.
Now granted price can go significantly further down( which I suspect will happen at some point...)
But as a C4 Scalper using Edge rules, I don't want to hold this position for a swing perhaps....
Ignored
Would it be reasonable to believe that when price moves into a certain proximity of an unresolved Red Star one might book say 75% of your scalp profit and feel comfortable to let the balance go to the Star?
Attached chart.. 5min "superfly" also known as Sterling/Yen.
I've highlighted my TP's... 2 of them...notice how price oscillated above both Red Stars, not below yet...
That's Price in real action.
-A decision was made to take price parabolic for the day.
If price oscillated below the Red Stars and closed, I would not of used these areas as targets.
Now granted price can go significantly further down( which I suspect will happen at some point...)
But as a C4 Scalper using Edge rules, I don't want to hold this position for a swing perhaps....
What Swingman has done has made it very easy to visually backtest this great system with differnt time frames and scenarios. This is one of the main reasons I like colors. Very easy to test out different strategies by scrolling back and doing some work with the crosshairs, etc. One thing that really stands out is using the half hour time frame on certain pairs (EU being one), and seeing how often you would get at least 10 pips trading soon after the trix lights up in the opposite direction, even considering that the trix sometimes appears late in the particular time frame. I figured entries the bar after the trix arrow, and come up with over 80% winners of a minimum of 10 pips factoring the spread. Will see how it goes in the upcomimg weeks. Thanks once again to Swingman for the new Trix and new colored candles that match the trix, making the forex charts much easier to review.
Man, finally managed to get to the end of the thread. Every time I clicked 'next page', there was an extra page at the end. I felt like I was on a touch the red light in the distance, only to realise once I got close that the red was indeed the brake lights of a truck that was on the move!!!!
The multi indicator versions of trix by SM are just a work of genious. Many thanks to you.
There is no shortage of additional indicators, which I knew would happen. Basically, everything additional falls in 2 categoris when it comes to scalping:
1. How to stay out of range
2. How to have a directional bias.
It would take a very experience scalper and a good understandng of PA to be able to make these decisions just based on the charts in post 1. It is possible, with some screentime, but maybe hard initially.
The only way to stay out of a range is to first recognise we are in one!! Seems simple enough, but usually it is after 1-2 losses that most traders recognise this (myself being guilty of it on more than one occassion). The best way I have found is that once a wave has started, and you have missed it, just wait for the reversal on that pair. Eventually it will happen. Or you can just skip that pair, since we are looking at more than 1 pair. Use lower low, divergence, pivots etc to spot the reversal.
Directional bias. When scalping on a 5m chart, there isn't much point at looking at a1H chart, as far as I am concerned. It takes 12 bars to make up a 1H bar, and there can be lots and lots of oscilation in those 12 bars. 30M is the max in my opinion. The use of mtf trix, higher ma etc, all are viable alternatives. The trick is finding which one you are comfortable with, and then STICKING TO IT.There are enough 5M threads on FF for a trader to find the reasoning, validity and reliablity of different MA, eg 34, 60, 150, 200 etc.
When starting out in scalping, it is better to have a directional bias. Gives better discipline, and if your trade ends in a loss, it is a very good sign (mostly), that a reversal is not too far away.
Looking forward to the next phase of lessons that Edge has for us.
P.S. Not to brag here but being a PhD scientist myself, it doesn't really help in trading. Trading is a great equilizer....
Ignored
Many of us on this thread are scientists of distinguished achievements in our own professional world. We have tried to make this point several times over.
Many High school students are sucessful traders.
Trading has got nothing to do with alphabets before or after one's name.
The real trader has experience in trading and account growing consistently. Usually humble and not needing reassurance. Their posts transfer wisdom (Not intellect) and can be recognised by others on the same wavelength.
The wisdom from experience whether from life experience or trading experience does not equate to degrees. Those that need to advertise their degrees shows some insecurities in themselves which they are trying to fulfill and need acknowledge from the world they live in/around them.