I should exit when currencies cross each other, yes? It means - when currencies meets (touch) each other or when as Dreamliner wrote in the first post:
when the currency pairs cross (the one that was on the bottom is now on top, the one that was on the top is now on the bottom) ?
I always existed when currencies meet and touch each other.
Enter when there is a gap, exit when in profit, or wait until they cross completely, your choice. Please demo, demo, demo. That way you'll see it in action.
Enter when there is a gap, exit when in profit, or wait until they cross completely, your choice. Please demo, demo, demo. That way you'll see it in action.
Ignored
Ok.
Another question:
do you trade during the busy hours (full of news releases) or wait till most indicators have been published? Also what tf is your favourite? Do you trade small time frames like 5min? Or 30min up?
do you trade during the busy hours (full of news releases) or wait till most indicators have been published? Also what tf is your favourite? Do you trade small time frames like 5min? Or 30min up?
Ignored
Personally I trade any time and all times, on the 30 minute which is my favorite.
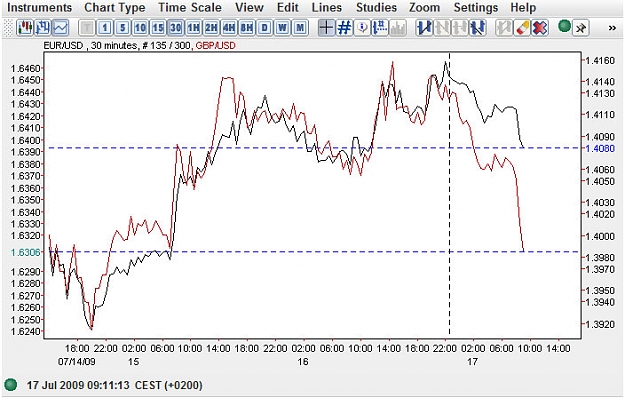
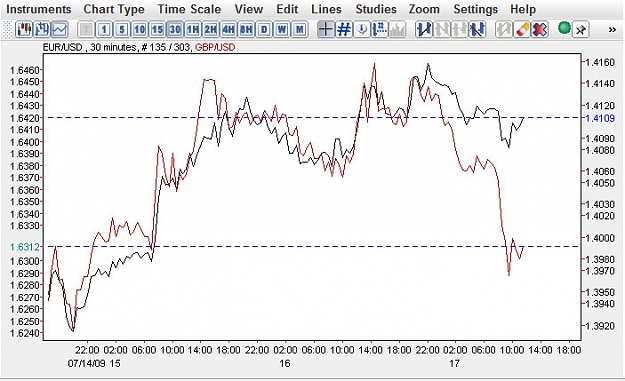
OK guys I told you I would show you a picture of my latest trade. On the top picture the two horizontal lines showed the price on entry, on the bottom picture the two vertical lines shows the time of entry (the first one is the first entry, the second is the second entry as I averaged in).
The currency pairs are Eur/Gbp and Gbp/Chf. I went long Eur/Gbp and short Gbp/Chf. These are very negatively correlated (above 90%). I also traded long Gbp/Usd and short Eur/Gbp.
Now, the big problem with doing this is obviously that you are simply shorting the GBP. It would be like trading Eur/Usd long and Usd/Chf short, which is merely shorting the USD. So people will no doubt come in here and say how horrible it is to trade this way.
However, if you simply look back at the charts you will notice big gaps followed by crossing, followed by big gaps, over and over. It is a statistical probability that after a gap there will be a cross. So I took the trades at the gap and closed them at the cross.
While people will not like this kind of trading stating that you could just as easily have traded short Gbp/Usd, the problem is I would not know when to enter or exit the trade, nor really which direction to trade it. But with this method I am clear on both.
So the result is +3.5% on the one trade, and + 2% on the other, for 3 days of being in the live trades. So while some will complain about this kind of trading, isn't trading simply doing what works for you?
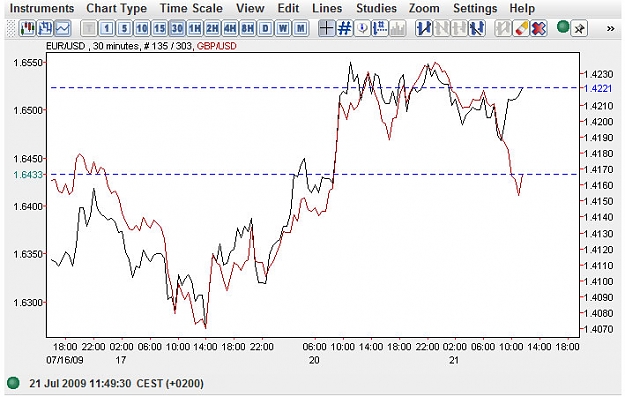
I traded similiarly today. I made my first entry at roughly the same time as you did, and made a second entry later in the morning when I saw the two pairs move opposite for a short time.
I trust that you were profitable as well? I closed all orders late in the afternoon, I try not to hold positions over the weekend.
Ignored
Yep, green pips caught. I also close my positions at the end of a day.
One could also record the close data for each pair on a specified time frame (ex: 5M) and then compare the delta between the 2 pairs. I believe MT4 allows exporting live data into an excel spreadsheet. With this you could look back historically to review the wide divergences and also use to trade in real time.
The way price is moving doesn't matter. The only thing that matters is the difference between the prices. Timeframe doesn't matter either for that matter.
I strongly suggest people read the "Correlation Strategy PDF" and look at the "Pairs.xls" listed earlier in the thread.
If you normalize the price difference you can clearly see the way the 2 pairs move together. Like a rubber band, they stretch apart, then come back...Sometimes they cross and flip. Once you get a handle on this behavior trading should be pretty straight ahead.
That is why I really like this approach; we negate the market's ups and downs, and are trading the high probability repeating difference of the pairs.
The way price is moving doesn't matter. The only thing that matters is the difference between the prices. Timeframe doesn't matter either for that matter.
I strongly suggest people read the "Correlation Strategy PDF" and look at the "Pairs.xls" listed earlier in the thread.
If you normalize the price difference you can clearly see the way the 2 pairs move together. Like a rubber band, they stretch apart, then come back...Sometimes they cross and flip. Once you get a handle on this behavior trading...
I've built an indicator based on the info in Pairs.xls and the accompanying PDF file.
When normalized price difference reaches one side of the range or the other, you know (or you can at least be pretty sure) that the difference will now go the other way.
You could manually adjust the Pairs.xls and enter the close prices for your pairs by hand, and generate a graph that will show you the normalized price difference.
Ignored
Have you posted this indicator already JM? Is that the one you posted earlier? Maybe you can repost it here for the sake of people being able to find it.
Thank you.
PS. I've had huge profitability trading negatively correlated pairs with this system.
No I haven't posted it yet. I don't want to clutter things up posting half assed code. I'm still tweaking and testing. No idea if/when it will ever be ready for prime time, but when I'm happy that it is working well I will post it.
Honestly though, it is just an MT4 implementation of the Pairs.xls graph. So in the meantime people can enter data into that (the close price will be what you want) and see historically as far back as you want, what the historical range is. You can continue to add to it as new bars close. I would suggest 1 hour bars.