well, if you're thinking that break of 153 would mean falling big time... just keep in mind that it is never that easy.
it might test the lows then head up again to mid 156 area. check that on daily charts, you will find it very interesting.
well, if you're thinking that break of 153 would mean falling big time... just keep in mind that it is never that easy.
it might test the lows then head up again to mid 156 area. check that on daily charts, you will find it very interesting.
Ignored
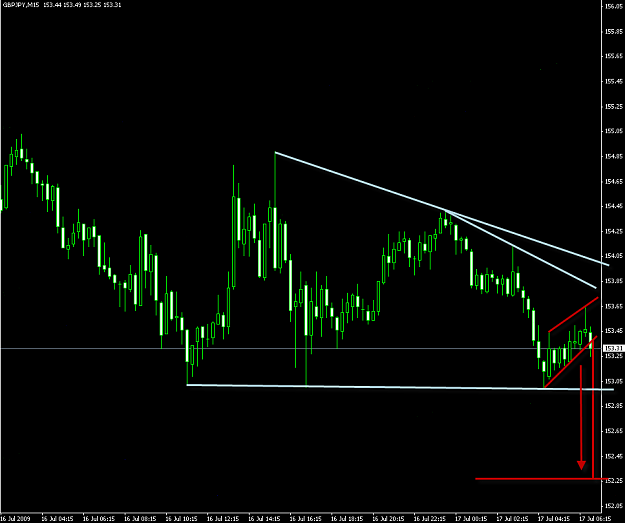
Agree with you.. at 152.30 Divergence on All TFs will be super Bullish..imo
Note we have a Falling Wedge. Break should be to the Up side.
Or we Could have a Bull flag formed ..It can go to 155.25 first and then to 152.30 (Confusion)..
Either ways I am Watching RSI Divergence on 15M.. 1HR..4HR.
We do have a Tripple Bottom.. so expect a small Bounce and then slow Dumping.
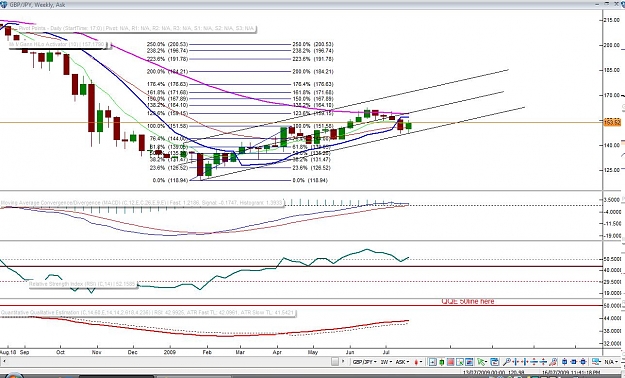
i've a question, here's a weekly chart. Yes, GJ did break the trendline going up, which would mean it falling, however we are above both SMA (don't not sure which ones), on weekly for first time since July of 07? So I guess judging by SMA we could be in an long-term uptrend until it wants to get below, which could be 240 or whenever. But if we're just looking at the recent rally from 120 to 160 then maybe it's different. Anyway, just wondering thoughts.
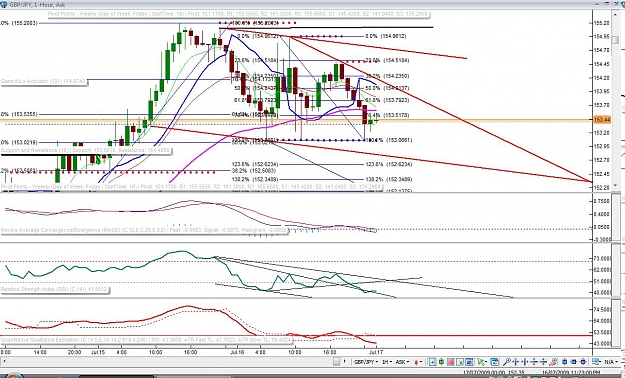
with the LTL at 153.00; If that is the case/.. then this is very bearish pattern, - a Stopping one, or Reversal pattern on Bull move... Be carefull with TLnes. Gann 4h crossed, However after the cross, we may have a 5sma [4h] as a retreacement here
Moscow open in 0:30 Dubai in 1:30min; we should see some more volume kicking in very soon...
(IGM)[BORROWING FROM THE FED] fell $4.474 bln to $111.893 bln on a weekly avg basis but was up $0.804 bln Wed-to-Wed...
[BORROWING FROM THE FED] fell $4.474 bln to $111.893 bln on a weekly avg basis but was up $0.804 bln Wed-to-Wed to $113.286 bln in the statement week ending Jul 15. The Wed level was $1.393 bln above the weekly avg. Primary credit borrowing fell $0.509 bln to $34.457 bln wkly avg and was up $0.223 bln to $34.743 bln w/w. Secondary credit borrowing was...
Ignored
"Don't trade to trade . . . trade to win." - James16
i've a question, here's a weekly chart. Yes, GJ did break the trendline going up, which would mean it falling, however we are above both SMA (don't not sure which ones), on weekly for first time since July of 07? So I guess judging by SMA we could be in an long-term uptrend until it wants to get below, which could be 240 or whenever. But if we're just looking at the recent rally from 120 to 160 then maybe it's different. Anyway, just wondering thoughts. Attachment
Ignored
Another Way of looking at the Trendline. and Fibs.
hmmm. looks to me as a Descending Triangle http://chart-patterns.netfirms.com/descending.htm.. with the LTL at 153.00; If that is the case/.. then this is very bearish pattern, - a Stopping one, or Reversal pattern on Bull move... Be carefull with TLnes. Gann 4h crossed, However after the cross, we may have a 5sma [4h] as a retreacement here or lower... on some other Resistance..
Moscow open in 1:30 Dubai in 2:30min; we should see some more volume kicking in very soon...
OK, bro.. there are many ways to look on that patterns.. but,...when some RUN or trend ending with a formation of a Descending triangle, that "usualy" is a sign of distriburion - end of the run, or reversal pattern..
the other way is when we are in down trend, and we are forming a FLAT bottom... - then we may break the UTL..
However, the option of FAILED one is always open in both cases..
[and note.. also.. this is not a faling wedge.. the LTL is a horozontal line..]
cheers!
Ignored
YES,, there are various ways of looking at it..
Best to trade the Break out.. or Scalp in between..
It is a Wedge,, I think.. I posted a chart 1hr..
I could be wrong .. you could be right.and VICE VERSA. .
Do you believe in Illuminati and Santa Claus as well ?
Ignored
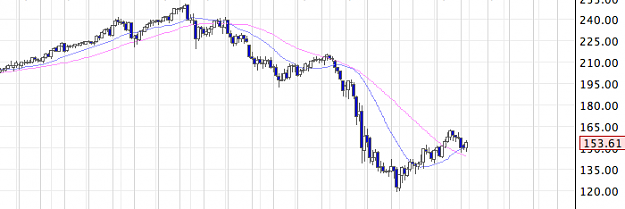
lol ok watch ..... something going on 7% gain in 3 days on no volume. ... yes I believe in manipulation and I believe that the rich drive the markets and the world and nothing is random .. nothing
lets see all majors banks report this week .. the weekend before CIT (I guess only 1 million retail customers at risk of having their line of credit shut down and all of the credit default swaps being called in .. wonder of they can even pay out) may file for bankruptcy ....does that not sound odd, would that not be designed top push markets higher. Handy how BOA eps estimates is 27 cents and citibank -26 cents(these are both major banks of the US and in reality 27 cents per share is barely breaking even or even a loss if the mark to market ruling was no abolished) . They should both blow those out of the park pushing the market even higher.
GS news on Monday right before earnings the following day, pros love selling into strength.
I guess no manipulation anywhere ....lol rofl .
No offense but this shows you have no clue how the markets actually work.
Recently one of Goldmans ex traders stole their software. Goldman themselves said he could manipulate the market with it and set the feds on him...what and they do not ?
wasn't it Goldman that said oil $200 at 145 before the collapse at 148. ? was this so they could look like complete fools before the collapse or so that they could get another 5 - 10 a barrel higher to short it at $1000 per point per contract on the futures ?
also Goldman trade 30% of US stocks in their own private accounts behind closed doors.... why the secrecy if they do not manipulate the markets ?
OK, bro.. there are many ways to look on that patterns.. but,...when some RUN or trend ending with a formation of a Descending triangle, that "usualy" is a sign of distriburion - end of the run, or reversal pattern..
the other way is when we are in down trend, and we are forming a FLAT bottom... - then we may break the UTL..
However, the option of FAILED one is always open in both cases..
[and note.. also.. this is not a faling wedge.. the LTL is a horozontal line..]
cheers!
Ignored
this w infor is a swing information to me i am buying on the test of w center ....i really dont care what news say .....the effect of news dont take effect instantly this will be like last year scenario when the time come so let see how it play out.
when the time come i will shout bull again...just on the side line now holding my short from 154.67 and add a new short at 153.63 target 50 sma on 4hrs.. http://www.forexfactory.com/showpost...stcount=184753