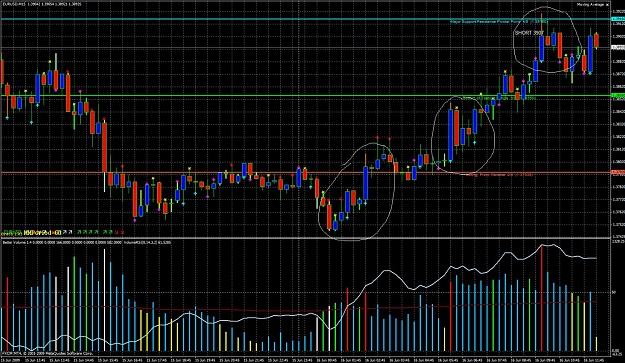
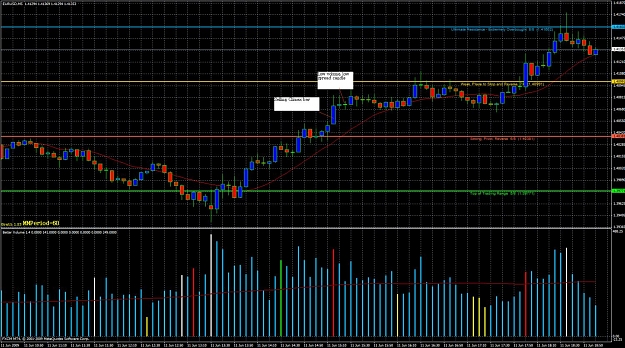
I have circled climax up bars that showed weakness on the next candle but prices continued to rise. Looking for opinions on why that is so. Also, what confirmations do you use to determine whether the price action is weak or not.
Thanks
Thanks
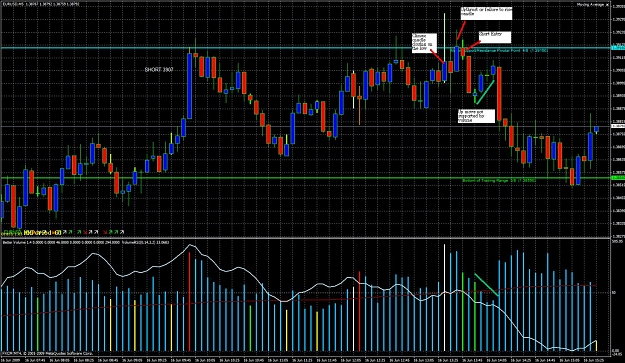
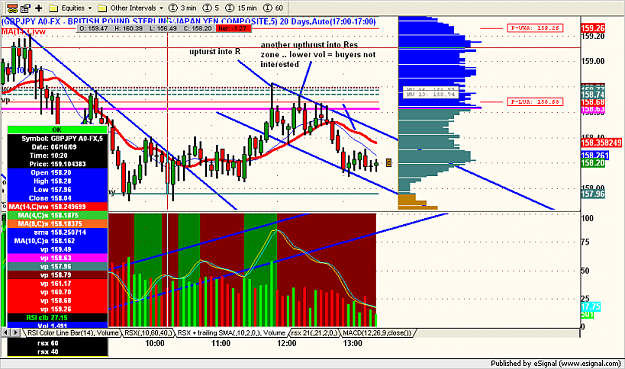
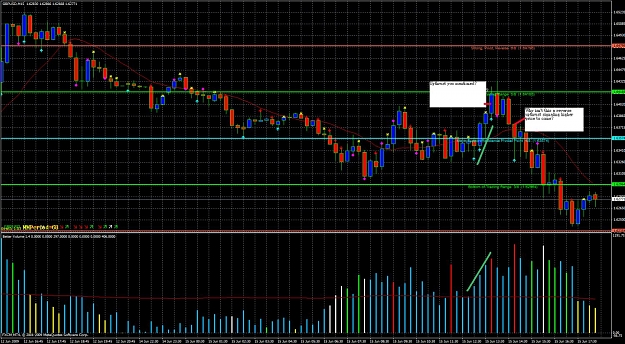
Attached Image (click to enlarge)