since many traders here are talking about volume and are trying to implement it in their trading, i wanted to make a couple of comments about this.
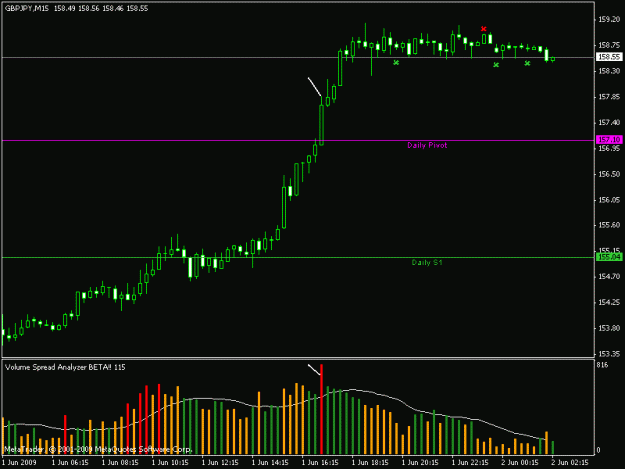
first, newbies that are interested in volume analysis must know that what we have in forex is TICK volume, not real volume. we do not see the number of contracts per price bar, but the number of ticks per price bar. to put it simple: we can evaluate the trend speed, but not the trend real momentum. it is like trying to guess the weight of a moving car by measuring its speed.
however, even under these circumstances, volume analysis works, but we must be extremely careful with our interpretation. we need to take account of price action and chart patterns - and this is why i wanted to post a pdf.
the attachment contains a schematic with important top/bottom patterns.
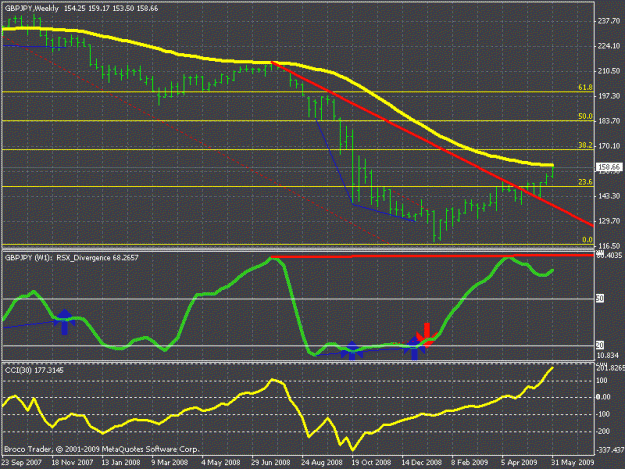
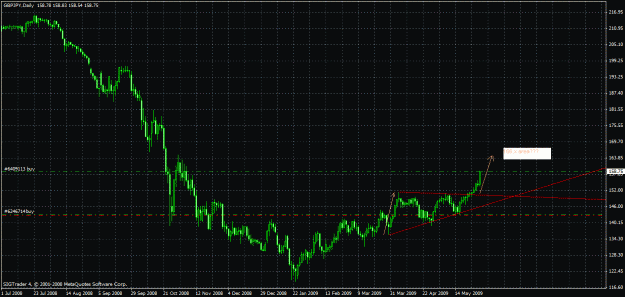
you should know how to recognize and how to trade these. just scroll back and stare at the charts - i would advise to start with higher timeframes, h4-daily-weekly, although same patterns can be seen on any timeframes.
it would be very simple: pick relevant tops and then switch on lower timeframes and try to identify accumulation/distribution.
hope this helps. good luck studying!
p.s. from my experience, i can tell you that these patterns work very well even without volume analysis... so, if you find vsa difficult to understand, go back to the naked charts and learn what to look for.
first, newbies that are interested in volume analysis must know that what we have in forex is TICK volume, not real volume. we do not see the number of contracts per price bar, but the number of ticks per price bar. to put it simple: we can evaluate the trend speed, but not the trend real momentum. it is like trying to guess the weight of a moving car by measuring its speed.
however, even under these circumstances, volume analysis works, but we must be extremely careful with our interpretation. we need to take account of price action and chart patterns - and this is why i wanted to post a pdf.
the attachment contains a schematic with important top/bottom patterns.
you should know how to recognize and how to trade these. just scroll back and stare at the charts - i would advise to start with higher timeframes, h4-daily-weekly, although same patterns can be seen on any timeframes.
it would be very simple: pick relevant tops and then switch on lower timeframes and try to identify accumulation/distribution.
hope this helps. good luck studying!
p.s. from my experience, i can tell you that these patterns work very well even without volume analysis... so, if you find vsa difficult to understand, go back to the naked charts and learn what to look for.
Attached File(s)
Nihil Sine Deo.