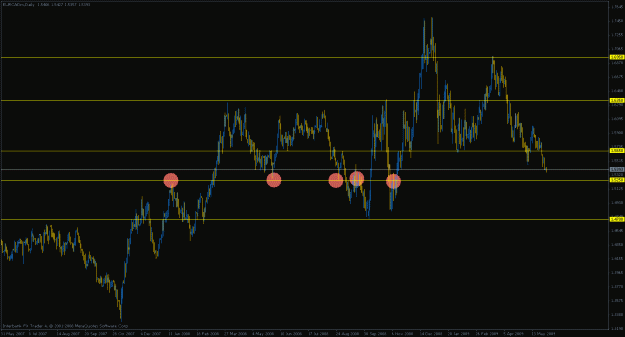
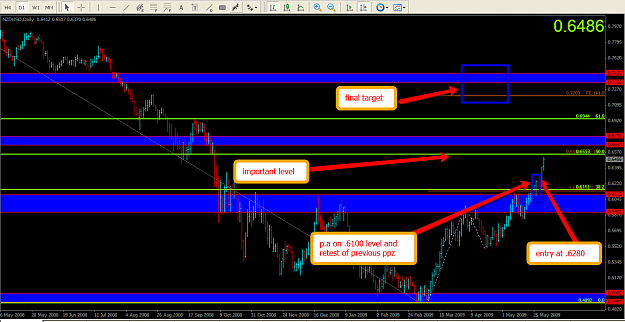
as i've posted earlier i'm currently long on this pair and moved my stop to break even point after hitting .65 level..thinking that if we can break through .66-67 level with no trouble than my final target might be somewhere .72-.73 level...
we'll see how it plays out...
To clarify, if I open a trade on Monday, for example, just let it ride even thought there is a NFP announcement on Wednesday, correct? Using normal money management, etc.
Ignored
Yes, except NFP is always on the first Friday of the month.
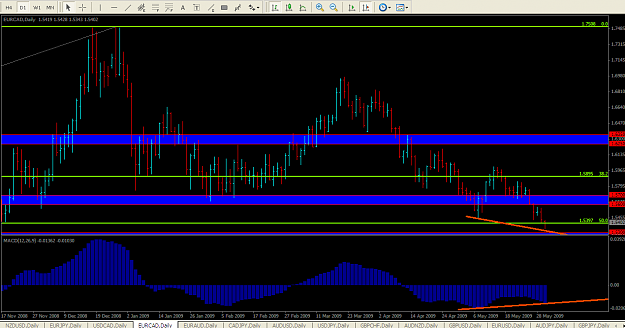
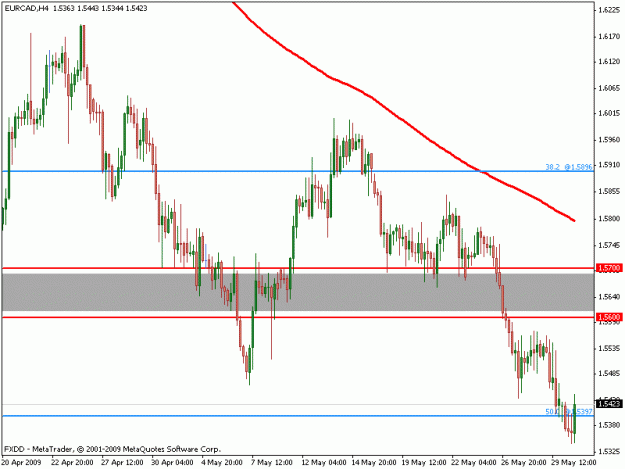
Could you please comment on the way I have drawn up with S/R lines on the EURCAD chart? Do you see any more lines that would make sense to add to the chart to look for trades? Which of these lines do you think are more like zones?
as i've posted earlier i'm currently long on this pair and moved my stop to break even point after hitting .65 level..thinking that if we can break through .66-67 level with no trouble than my final target might be somewhere .72-.73 level...
we'll see how it plays out...
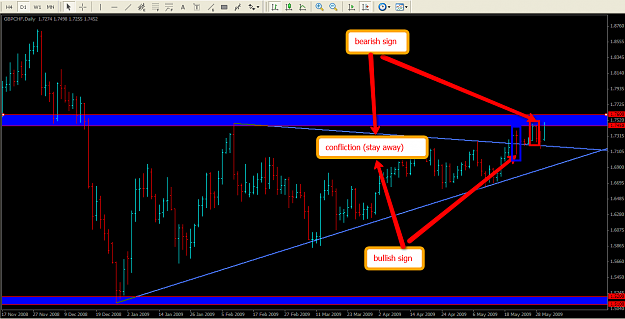
I'm happy that i followed Cw's rules about mixed p.a signals that saved me at least %2 of my capital one was this trade other was gbpusd...sometimes we should count our "no trade decisions" as our profits
Market is frustrating but it treats me well when I'm more frustrating than the market..
good free stuff to learn at http://www.learningmarkets.com
...... Support and resistance levels are not exact price points, they are price ranges. A good friend of mine has a great analogy for support and resistance levels. He says when you draw a support or resistance level on your chart imagine you are drawing it on with a big fat crayon, not a fine-point pen. That way you won't fool yourself into believing you have identified the exact price at which a stock is going to turn around and start moving in the opposite direction.
Also remember: Support and resistance are not infallible. Bad earnings announcements, economic events and other factors can shake a stock and dislodge it from a support or resistance level. But they give you an identifiable range in which the stock is likely to trade, giving you good insight into good entry points, exit points and expected price movements.
It’s also important to note that support and resistance (and all technical analysis tools, for that matter) are useful during virtually any period of time. You can use support and resistance during a six-month trend, or even during multi-year trends. In the video for this section we show an illustration of this principle. http://www.learningmarkets.com/index...ce-part-2.html
p.s:i'd recommend that you guys watch their daily forex analysis..they're pretty nice..
I HIGHLY recommend John and Wade's videos. A great place to learn general knowledge on several markets. A great place to start on options, stocks, etc.
good free stuff to learn at http://www.learningmarkets.com
......
[font=Verdana]Support and resistance levels are not exact price points, they are price ranges. A good friend of mine has a great analogy for support and resistance levels. He says when you draw a support or resistance level on your chart imagine you are drawing it on with a big fat crayon, not a fine-point pen. That way you won't fool yourself into believing you have identified the exact price at which a stock is going to turn around and start moving in the...
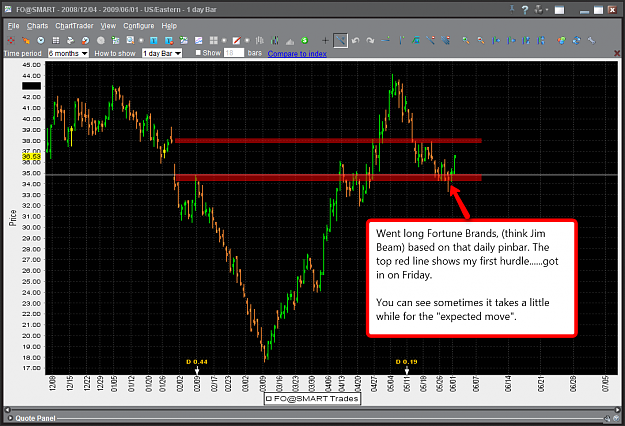
I made this chart back on March 18 after reading this thread and using the knowledge gained where the Vertical red line is and have not touched it since then.
Its almost like a fortune teller! And now we can see a beautiful pin bar forming at my lowest line of support/confluence. I can't wait to see what happens next!
It might be a little premature to call the usd/cad pair.
Additionally, under this method at what price level would the support line be drawn for this pair?