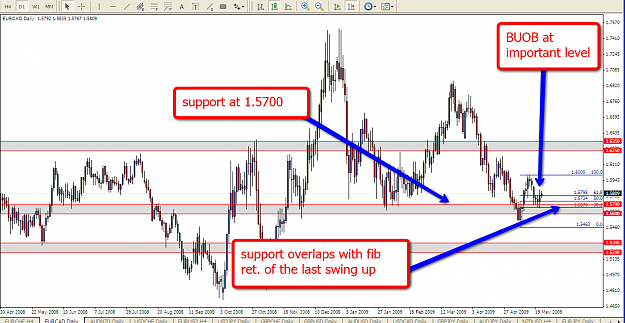
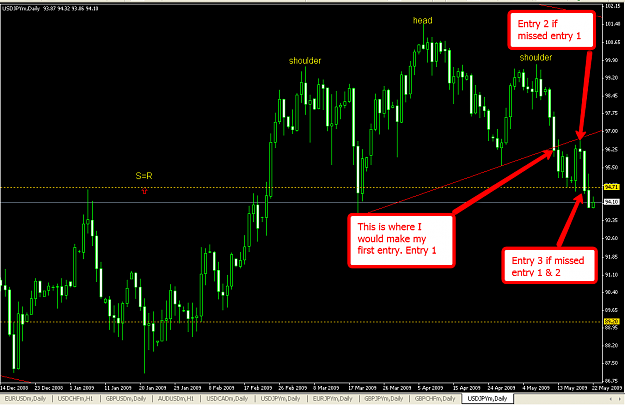
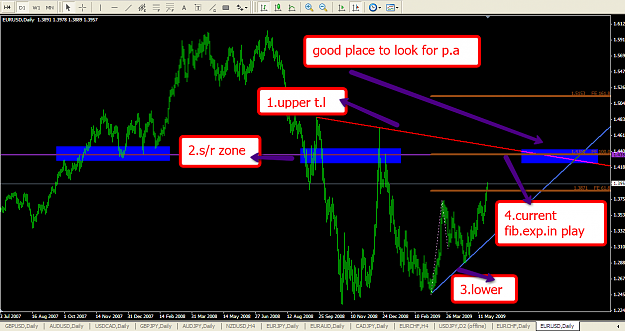
DislikedMy thoughts on that chart (other than that I hate your colour scheme!) is that as previously stated your s/r level should be 1.37 and 1.41, not even sure 1.40 comes into it. Did you zoom the chart out to its fullest extent when you looked at the weekly chart?
Other than that I'd draw the trenline along the lowest prices (ie the bottom of the wicks and not the closing prices).Ignored
Tks for the reply, not sure what I can do about the colour scheme though
Tks for the reply as well djarum