It has come to my attention that we are possibly preparing for the next leg down in the equities market which may cause the safe haven principle of dollar and yen strength. While there may be fundamental reasons for that scenario to happen this is a technical analysis post only.
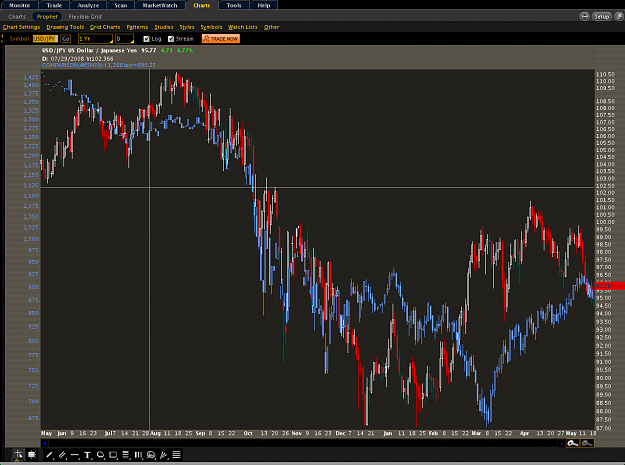
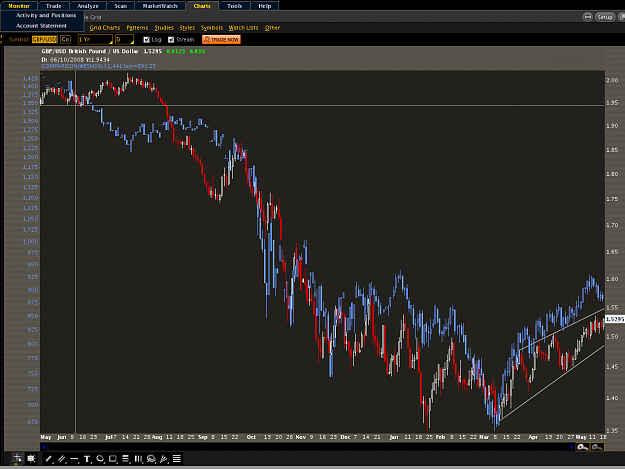
First off, for all that follow correlations between the pairs, you probably remember that the yen pairs where usually the first indicator of in which direction the overall markets are moving in the last 6months of 2008. Ak_4x pretty much mentioned it every day with his brilliant method of playing pivots.
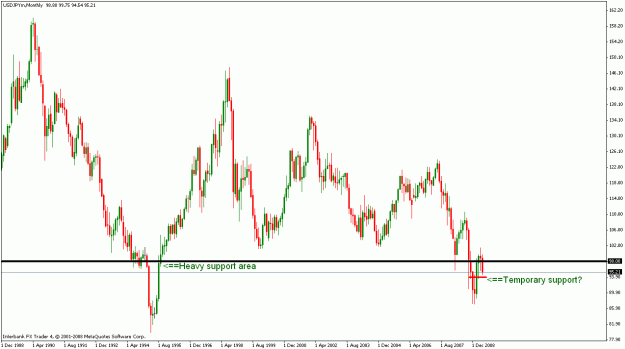
Secondly, for all those that know me (and those of you dont will know now ).... you know that I heavily rely on support/resistance areas and how price action behaves at those levels, be it candlestic patterns, triangles, etcetera. And this is where I came to realize something.
A strong support is where pa struggles to get through. Simple right? Going back on the monthly charts for the USD/JPY as far as my platform will allow me..(1988)...we see that support at around 98.00 for the USD/JPY pair. After the last 2months brought a consolidation above 98...we have broken through that level decisively recently and seem to be poised to retest the lows at the very least...if this temporary support area around 94 doesnt hold up.
Which brings me to my next point in correlations..it probably means more dollar strength if history wants to repeat itself (wonder what the books say). As a side note (would you buy 60$ per barrel oil if you could?)
opinions on this analysis much appreciated....be it reasons to agree or disagree
First off, for all that follow correlations between the pairs, you probably remember that the yen pairs where usually the first indicator of in which direction the overall markets are moving in the last 6months of 2008. Ak_4x pretty much mentioned it every day with his brilliant method of playing pivots.
Secondly, for all those that know me (and those of you dont will know now ).... you know that I heavily rely on support/resistance areas and how price action behaves at those levels, be it candlestic patterns, triangles, etcetera. And this is where I came to realize something.
A strong support is where pa struggles to get through. Simple right? Going back on the monthly charts for the USD/JPY as far as my platform will allow me..(1988)...we see that support at around 98.00 for the USD/JPY pair. After the last 2months brought a consolidation above 98...we have broken through that level decisively recently and seem to be poised to retest the lows at the very least...if this temporary support area around 94 doesnt hold up.
Which brings me to my next point in correlations..it probably means more dollar strength if history wants to repeat itself (wonder what the books say). As a side note (would you buy 60$ per barrel oil if you could?)
Attached Image (click to enlarge)
opinions on this analysis much appreciated....be it reasons to agree or disagree
Different opinions highly valued, ignorant to slander.