this is open position on Oanda. So it s showing us where the retail traders did long or sell. in this picture we see that they massively sold the yen in the last range we have (GJ and EJ as well). by now the pros are marking up the price so all the retail sellers will be loosers, waiting for them to close their short before going down swiftly (that s my view, i don t really know if i m wrong or not)
the retail traders (massive seller in the range) are now in...
Ignored
Thanks for the answer.I still have problem with reading the oanda chart.
When you say Pro's are selling and retail traders are in a difficult position ,How do you see it in this specific chart.I understand why this is happening
from VSA point of view but I can't read it from your chart.
I don't know what is the blue or green lines or other stuff in the chart.
Hirek,
I'm kind of joking when I said indicator, to see who is buying and selling is a very good thing. I was away from trading yesterday,could I ask you how you came to the conclusion that the pros were accumulating? Still learning VSA
Thankyou
Ignored
i m a still learning too but that s the way i ve read it. green arrow are showing stopping volume, that is buying on the dip of the range, while on the high there is little interest of selling except when a rally is starting. Red arrow show the low activity on top. there plenty of other thing, you have to see each activity bar.
If a VSA master want to corrext me about the interpretation, i would be great full since i m only trying to use what i learned from the book.
yellow is showing trader in good position (making money) and blue traders in poor position (loosing...). u know the amount of traders by the % on the vertical scale and the horizontal is at which price they bought or sold.
So if the price of GJ or EJ is going up, the chart will shift to the left... well i don t know if i m clear... my english is very poor so if someone want to explain
I find the Better Volume indicator the clearest, and from what I can gather, is the one used by most others - which makes things easier.
Not to blow my own trumpet or anything, but the post I made here shows a good example of the type of things I look out for when using VSA.
I pretty much watch volume on 15-min exclusively.
I pretty much watch volume on EUR/JPY exclusively.
I have found that there are a lot of things to know with VSA...
Ignored
I just downloaded the better volume and will give it a spin around the block today.
I'd LOVE to do this all day, but bummer I have to work! Helps to be self employed !
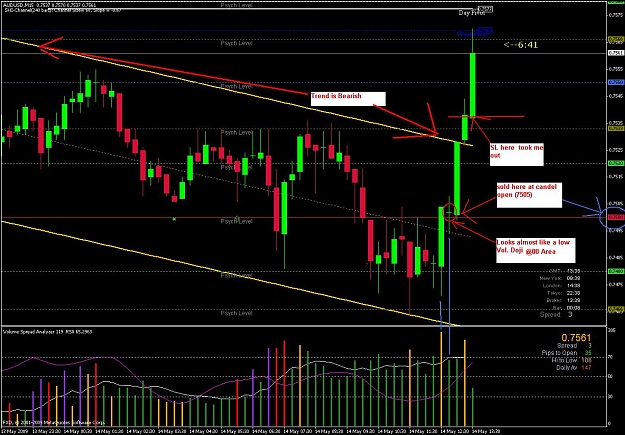
im still learing this vsa stuff, i like it. This was my vsa trade for today. I cant see any mistake. Hope someone can explain me what i do wrong! Thanks in advance!
im still learing this vsa stuff, i like it. This was my vsa trade for today. I cant see any mistake. Hope someone can explain me what i do wrong! Thanks in advance!
PS: Sorry for my bad english
Ignored
bbartha, I'm going to ignore volume completely here in my analysis - you'll see why.
I appreciate that this is after the fact, but nevertheless, relevant.
Some thoughts are on the attached charts.
However, there is really only one thing to take from the charts below... and that is... the 0.7460 area... major S/R level!
Absolutely no way would I even consider a short here.
Using price only there are however a huge number of reasons to go long...
|
Joined Apr 2009
|
Status: Student of Price Action
|258 Posts
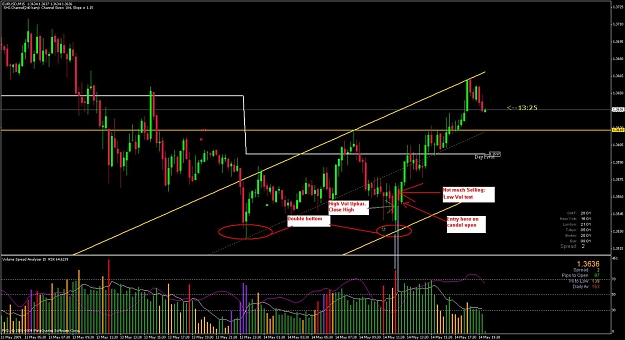
Hi, I'm really new to VSA too, so I'll just give you my best guess at what went wrong. I probably would have bought at the low volume down bar right before the up move, because it shows that there wasn't really much supply/interest in selling. Plus, it had really strong volume bouncing off the bottom of your channel, which is where you would typically trade countertrend until it hit the resistance at the top.
Experts in the thread, is my understanding correct? Please correct me on anything wrong. Thanks!
im still learing this vsa stuff, i like it. This was my vsa trade for today. I cant see any mistake. Hope someone can explain me what i do wrong! Thanks in advance!
Here is my eu H1 chart:
pink bar at the double bottom to stop the fall, next red = power boost all up, next green to hold above 50% fibs on daily and here we go...
I love this way of trading!
I've not been doing this long enough to know whether to discount volume during news events - but I'm open to thoughts on this from others.
Ignored
News are used frequently for marking up the market. They should probably be ignored as such. What we must never ignore is how the smart money are using good or bad news to mark the price.
I am not an expert. This is from MTM book, which im re-reading now. AU trend reversed nicely following the news.
i m a still learning too but that s the way i ve read it. green arrow are showing stopping volume, that is buying on the dip of the range, while on the high there is little interest of selling except when a rally is starting. Red arrow show the low activity on top. there plenty of other thing, you have to see each activity bar.
If a VSA master want to corrext me about the interpretation, i would be great full since i m only trying to use what i learned from the book.