I have to say that i find VSA extremly confusing. I don't understand why the traders use, and post small time frames, when we are supposed i thought to be using larger time frames. I feel this is turning into a scalping thread.
I have to say that i find VSA extremly confusing. I don't understand why the traders use, and post small time frames, when we are supposed i thought to be using larger time frames. I feel this is turning into a scalping thread.
Ignored
There is nothing confusing here.....The basic rules works on any TF.
You can not expect from everybody here to trade same TFs, there is no limit for that, you can use it on any TF you like(except 1min/to much noise).
I personaly use 6 TFs to make a final decision!
I have to say that i find VSA extremly confusing. I don't understand why the traders use, and post small time frames, when we are supposed i thought to be using larger time frames. I feel this is turning into a scalping thread.
Ignored
Because the "small" TFs work...
Who says were are supposed to use larger TFs?
R Richards, hang in there... VSA is daunting at first... a read of MTM will change your views on the markets - I have no doubt about that...
Malcomb you are dangerous....not only you are an addict,
you are dealing drogs here.....LOL
I guess that Shamous is than responsible of opening a Coffee shop.
I have to say that i find VSA extremly confusing. I don't understand why the traders use, and post small time frames, when we are supposed i thought to be using larger time frames. I feel this is turning into a scalping thread.
Ignored
I'm sure most people look at larger TF's as I do for direction/background.
Then use smaller TF's to pick entries.
Since Malcolm likens VSA to reading a book I'll add this analogy... lower timeframes enable you to read between the lines.
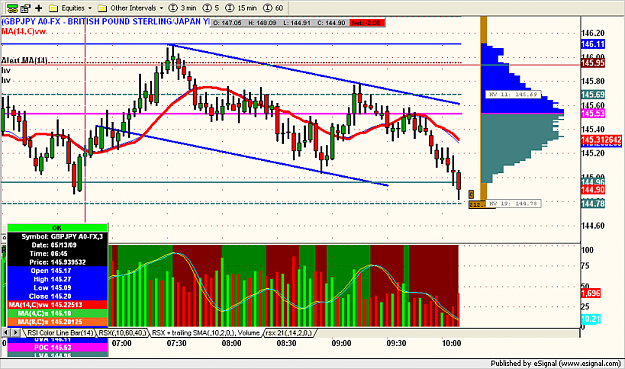
We have a nice No-Supply bar forming on 30min TF for GJ!
Doji – Located near the top or bottom of the trend, this is considered a No-Demand or No-Supply bar; it is narrow range and the opening and closing price are close together and that the volume is relatively low compared to the average. This No-Demand/No-Supply identifies whether the buyers or sellers are still in the push. This is a small window to peek at the possible reversal in the making.
I think the general theme is that you take what the very latest volume bar(s) are in relation to the few before it - whilst also paying attention to background weakness/strength.
In your 1-hour chart example, it seems too zoomed out. You have highlighted the peak volumes - but to me, they are only a small part of VSA. Also, I think the peak hourly volumes may be coinciding with news releases - that's something to watch out for.
Ignored
thank you fo your answer. I like to watch the market from a big history in order to see weakness or strenght in the background. That s why my chart was too zoomed out.
From the MTM, i have undestood that even volume on news want to say something. Maybe my high volume bars wereon nexs but i tried to have them saying something to me. i just wanted to be corrected if i was wrong so far, i m doing good with this trade.
every body seem to look at GY.So i m seeing some accumulation on the 5 mn.Do i get this wrong? maybe we will see a nice move up to the top of the range ~148?
I'm sure most people look at larger TF's as I do for direction/background.
Then use smaller TF's to pick entries.
Ignored
Shamus (and others),
How do you find the 1h and 4h with regard to volume?
I only look at volume on 15-min mostly. I find when I look at it on the hourly, I see it rising to a peak during Euro session, through to US session, and then dying down to a lull through Asia. And news seems to throw things off. Difficult to interperet bar to bar with such variance.
This is for E/J at least.
Magnus
Ignored
I like the h1 as it encompasses the whole range of lower tf's in one candle. It's a quick snapshot.
I take a look at it at the start of each hour and flip back to it here and there to get a broader picture during the current candle as well.
Thank you Shamus for the reply. I guess for me, looking at the 15, and the 5 min TF, does not make much sense, when i need to wait for my hour bar to finish before making a decision. The 15 & 5 could change immensly in that time. I guess in seeing what the lower TF has to say when it is close to the closing of the hour may help me in some way.
How do you find the 1h and 4h with regard to volume?
I only look at volume on 15-min mostly. I find when I look at it on the hourly, I see it rising to a peak during Euro session, through to US session, and then dying down to a lull through Asia. And news seems to throw things off. Difficult to interperet bar to bar with such variance.
This is for E/J at least.
Magnus
Ignored
i had the same problem, that s why i wrote an indicator that really show me unsual volume (high or low). I calculate the average to compare it. you will fond it here http://www.forexfactory.com/showpost...postcount=1259
i had the same problem, that s why i wrote an indicator that really show me unsual volume (high or low). I calculate the average to compare it. you will fond it here http://www.forexfactory.com/showpost...postcount=1259
I have been looking at ForexFlash's TickVolume indi since he posted it. I think it's a great indicator. The problem I have is that I never get the same info with it that others have posted. There is never the substantial difference between buyers and sellers on my charts that I've seen others post. I am using an IBFX live account, and I thought that it was one of the best with respect to volume data. Am I doing something wrong?
Ignored
I don't think the indi you are using is very good. (If I am wrong, can someone please explain better. I am new to this). It looks like the standard indicator on the MT4 with a bit of colour added to separate up and down volume bars. But even that can be helpful if you just pay attention to the amount of volume on the bars and compare it to the price action/spread.
I do not understand when you say there is "no difference between buyers and sellers on your chart"?
You can download BetterVolume indi posted in the first post of this thread. Read the book and the thread (or both at the same time) and you will understand what it shows.