DislikedI am looking for some videos showing the usage of VSA on Forex. Any ideas? Having a hard time grasping this concept.
ThanksIgnored
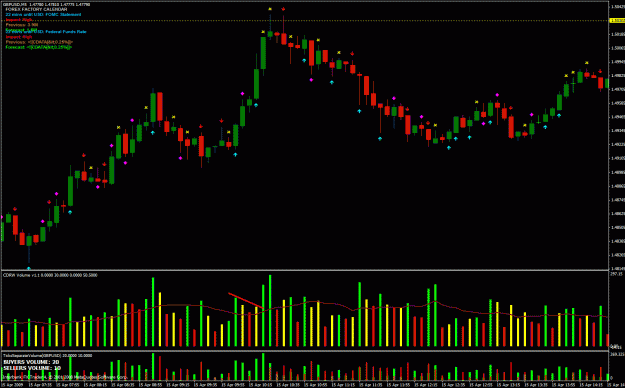
lets start with something simple ......
think of this ...price is declining on a 5 min chart , with reducing volume. That means there is no selling pressure. / interest .
Then you get a doji on an area of previous support on high volume.
With the lack of selling interest on the way into support , that high volumeo n a doji ( low spread candle) on support is buyers . (1 in attached chart)
You can either go long there OR wait for price to move up a bit , then come back to test support on LOW volume.(2 and 3 in attached chart) This is a double bottom. BUt the low volume on the test of support tells you that there is no selling interest . This is the entry for the long.
This set up was AN EASY TRADE this morning .....
Attached Image (click to enlarge)
Blogging daily now at www.volume.zone