sorry for rudely quoting your post
I saw your question on your chart. here is my answer.
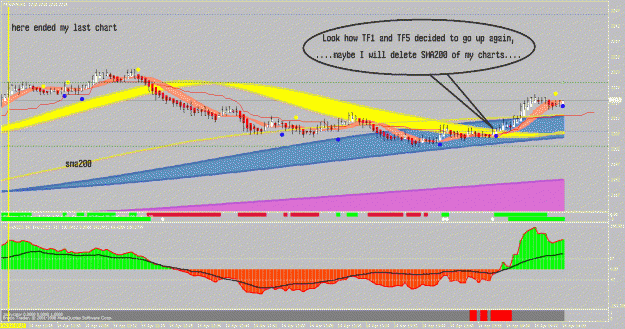
The 3 TF ribbons are coming together from different directions and all traders have to decide what they think price will go to do. Some were long and some others were short. So it can take some time before the decision for the next direction is taken, and it could also go to a sideways market for a while.
On the first point you marked TF1 is going up and price is going down, with a gap between these two.
At your second mark, TF1 is much better situated. Better in relation to price and better in relation to higher TF ribbons. Here it is more likely that price will going to fall.
Overall, in case of a reversal it is better if TF1 is falling out of the bigger TF zones and TickRibbon makes a pullback to TF1 zone.
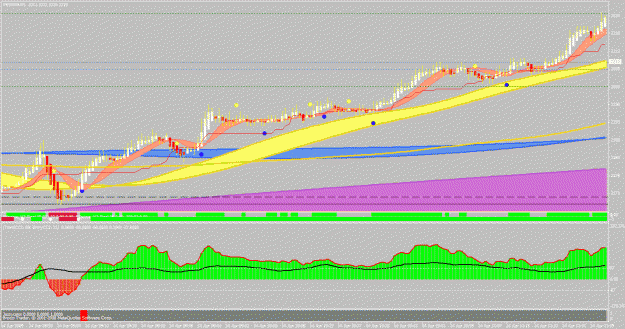
I noticed this is a chart from februari. You're really doing a huge backtest!
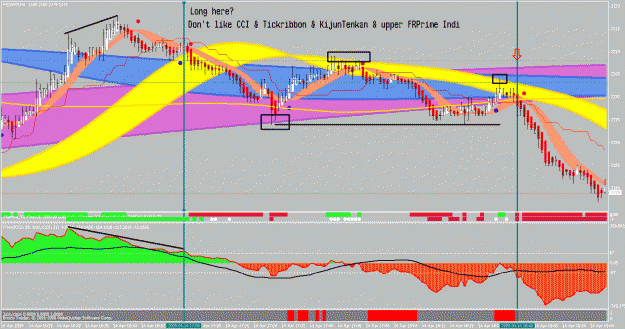
Trading S/R with PA only. No indicators anymore!