eur and gu have strong down selling pressure in back ground on 60 min charts .. this is why I said in other forum background is important. an ea will not work with vsa
it is sell rallies .. have been doing so past 2 session .. over 1200 pips now
eur and gu have strong down selling pressure in back ground on 60 min charts .. this is why I said in other forum background is important. an ea will not work with vsa
it is sell rallies .. have been doing so past 2 session .. over 1200 pips now
Ignored
Fair point Malcolm, I was going against my own advice to only short EURUSD at the moment!! Every day is a learning day...
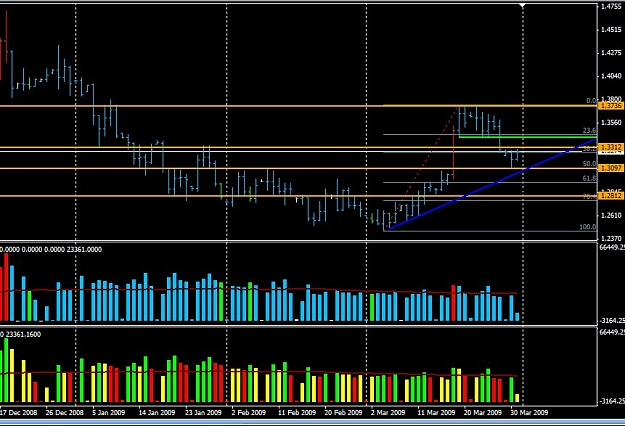
Thatwasme, I prefer to use your 'CDRW Volume' rather than the 'Better volume'. However I like the 100 day Average line you've put in the latter.
When I put a 100 day SMA line in on the CDRW indicator the lines are nowhere near each other(see chart). I am assuming that the low Volume Sunday bar has something to do with the problem.
Can you please offer some ideas to try and get both Averages to match?
Does anyone else think this was a no demand bar, or does the lack of an upward wick mean its not? I noticed the declining demand, and decided to short just at the close of bar, gained 30pips then jumped out.
Obviously time of day could be a reason for the no demand. From the interesting article willowgal posted. volume and trend, trends are strong if volume increases as price moves with trend and decreases when price goes counter trend.
This appears to follow that theme as we were in a downtrend for a few days on eu and volume was decreasing on moves up.
Hi Shamus et al I am enjoying the journey,perhaps here is another part of the jigsaw http://www.sfomag.com/homefeaturedet...er&YearID=2006
TK's article gives examples are from 5,10,15 and 30min charts on e mini.illustrating how it is possible to follow the distribution process in a short through to longer time frames to confirm weakness and see if there is a melody developing
In his own words
Quote
Disliked
Since we have already seen the proof of this on our smaller time frames, the musical notes are starting to string together to form a melody
Also my thanks to that was me, I just love the better volume indicator and watching what the smart money/ predators are up to. Its so much fun its a pity to trade it!
Thatwasme, I prefer to use your 'CDRW Volume' rather than the 'Better volume'. However I like the 100 day Average line you've put in the latter.
When I put a 100 day SMA line in on the CDRW indicator the lines are nowhere near each other(see chart). I am assuming that the low Volume Sunday bar has something to do with the problem.
Can you please offer some ideas to try and get both Averages to match?
If I understand, the CDRW Volume shows how volume bars relate to previous volume bars and Better Volume shows how volume bars relate to price spread.
So do VSA gurus use both on their charts? Or do those who post charts that have only CDRW Volume have no use for the relation to price spread?
(Just started on VSA and finding the learning curve steep.)
Second question: In CDRW Volume, what is "neutral volume" - for example, I see 3 bars that are green, yellow, red with relative sizes 1 : 0.7 : 0.5 and my problem is that I don't understand why the middle one is not red.
I believe some use one and some the other... I, for instance, use only CDRW volume - the relation to price, I make it mentally (requires learning the different meanings);
As for the colours in bars, it isn't absolute quantity, but relative quantity (to the previous two):
- If a volume bar turns bigger than the 2 previous, it is green;
- If bigger than one but smaller than the other, it is yellow;
- If smaller than the 2 previous, it is red.