819 was sell zone .... 2 high volume pivots there form 2 and yesterday .. that is where sellers were sitting and every time it came near i was getting high volume candles at resistance = sellers
was a no brainer , hopefully next week is as easy ...lol
The numbers on the better volume chart are the volume associated with each color of bar that is displayed. They are meaningless and should be ignored, I have not figured out how to get MT4 to stop printing them to the screen. If it is important to anyone, I will put some thought into re-writing the indicator to remove the numbers.
Ignored
No need for a re-write (for me anyway) - the important thing to know is that they can be ignored. Thanks for the response.
Another question, just curious, why did you code the Chart Bars into two parts?
No need for a re-write (for me anyway) - the important thing to know is that they can be ignored. Thanks for the response.
Another question, just curious, why did you code the Chart Bars into two parts?
G
Ignored
He did explain why somewhere on here... this was necessary due to MT4 programming restrictions not allowing enough arrays (or something ;-) to do all the coding in one program..... nothing significant I can assure you.
No need for a re-write (for me anyway) - the important thing to know is that they can be ignored. Thanks for the response.
Another question, just curious, why did you code the Chart Bars into two parts?
G
Ignored
Because each histogram that appears on the chart overlaying the price bar requires 2 index buffers, ( a Low and a High). There are 5 colors not including blue which is the default. So, that make 5 * 2 = 10 buffers needed.
Metatrader only allows 8 index buffers in a single indicator, So, I had to split them up amongst part one and part two.
Not meaning to seem harsh, but I am beginning to get the feeling people are not reading the thread. I have answered most of the questions about better volume a couple of times now. So, if I don't answer a question or a PM, it is probably because I already answered somewhere else, or the change that someone is requesting I see no use for and don't want to do. I posted the source code, so if the change is that important to someone, they can always have someone else do it. My code is always very compact and well laid out, and easy to read, and understand.
here are the improved versions. They will not revert back to defaults. I have set the default width at 2, but you can change them to any width you want to and they will stay put.
Ignored
Newb to this thread, read it through and also nyse's thread, I've been doing that much VSA reading and research my head hurts
I will be starting VSA next week and looking forward to joining you in trades on the chatroom.
Is it just me or does v1.2 of better volume still come up as v1.1 in the text on the top left corner of the indicator window? (just before the numbers that you can't get rid of)
Ignored
Could be I overlooked putting 1.2 on it. I cannot change it now, no edit on that post, so....
Here is version 1.3
In this version, you can select the lookback period for the Highest and lowest for the calculations of the churn bars and the climax bars and the low volume bars. As per the Tradestation version, the default is 20 bars, but you can change it to what ever you want.
and....
This version posts 1.3 in the indicator name. The logic is the same as the others, just an added input to manipulate. Also, 1.3 in the name.
Folks, I'm still learning this and would appreciate comment - please tell me if this is the wrong place for this.
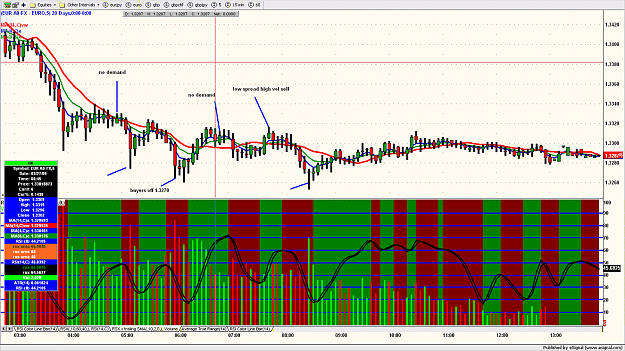
The bar at 16.30 GMT (the lowest point red bar half way on the screen) on the chart below (Fridays EURUSD, I made 108 pips although if I'd stayed in longer I could have been over 200!) - this is screaming to me as testing suppy by the market makers - do you agree?
The previous two bars (these are 5 minute bars) have below average volume down bars, and then suddenly we've got a over double the previous bar's volume, pushing the price below the previous low at 2.05pm GMT, but closing at almost the same price as opening.
My reading on this is that buying at 16.35 (1.3270) would have been good for a short 35 pips gain, but that this is likely to be a sign of weakness, because the price didn't shoot back up in the next few hours (unless Monday morning proves me wrong) and therefore unless we see a reasonable rise on Monday this is likely to go sideways for a while and then down below that low of 1.3260.
Any thoughts on my analysis or am I talking nonsense
Folks, I'm still learning this and would appreciate comment - please tell me if this is the wrong place for this.
The bar at 16.30 GMT (the lowest point red bar half way on the screen) on the chart below (Fridays EURUSD, I made 108 pips although if I'd stayed in longer I could have been over 200!) - this is screaming to me as testing suppy by the market makers - do you agree?
The previous two bars (these are 5 minute bars) have below average volume down bars, and then suddenly we've got a over double the previous...
Ignored
steve break this down into annotation .... or do note on chart
will be easier to correlate what you arte talking about to what is on chart
Could be I overlooked putting 1.2 on it. I cannot change it now, no edit on that post, so....
Here is version 1.3
In this version, you can select the lookback period for the Highest and lowest for the calculations of the churn bars and the climax bars and the low volume bars. As per the Tradestation version, the default is 20 bars, but you can change it to what ever you want.
and....
This version posts 1.3 in the indicator name. The logic is the same as the others, just an added input to manipulate. Also, 1.3 in the name.
I think that is...
Ignored
These are now linked from the main thread. Thanks for all you do Thatwasme.
The red bar (climax) looks like standard stopping volume in VSA. Which I find are some of the easiest signals to spot and enter on (open of new bar)
I would not try to read too much into the late NY volume on Fridays as it's usually profit taking and lower than average volume at the end of the week.
/me waits for Malcolm to yell at me.
I have to say like most of you reading this thread I am learning as well. I would like to thank everyone for their inputs both here and in chat because even when you are wrong you learn.
See you all at Tokyo open. Hope you are all having a great weekend.
PS Vantage and I were discussing checking out setups on EJ this week in the chat. Malcolm since you trade GJ alot and EJ seems to be a safer alternative what are your thoughs on EJ?
Joined Sep 2008
|
Status: hardcore chartist
|2,173 Posts
It's fine I was ignored. Someone else answered. And I do follow this thread avidly. Climax bars seem to kickstart some runs, stop others; I don't know why, though.
It's fine I was ignored. Someone else answered. And I do follow this thread avidly. Climax bars seem to kickstart some runs, stop others; I don't know why, though.
Ignored
Sorry if you felt you were ignored. I usually just zip to the last page of thread so perhaps I missed your post or didn't know the answer.
Hi to all on this thread, i congratulate all contributers for their excellent work
Thatwasme i wonder if you could code the better sine indicator for mt4.
i know you may be reluctant as you have suggested that we have what we need already and this is a vsa thread and focus should be this. but i suggest it as it is an excellent indicator and seems to work so well with VSA
take care and thank you
Folks, I'm still learning this and would appreciate comment - please tell me if this is the wrong place for this.
The bar at 16.30 GMT (the lowest point red bar half way on the screen) on the chart below (Fridays EURUSD, I made 108 pips although if I'd stayed in longer I could have been over 200!) - this is screaming to me as testing suppy by the market makers - do you agree?
The previous two bars (these are 5 minute bars) have below average volume down bars, and then suddenly we've got a over double the previous...
Ignored
steve , indeed there were buyers at 1.3270 level , this was shown at 2 other time before the bar you could have gone logo n , this is what I was talking about background .... look back 40 bars and you can CLEARLY see where the buyers are
In this case the top of range was very clearly shown also
Folks, I'm still learning this and would appreciate comment - please tell me if this is the wrong place for this.
The bar at 16.30 GMT (the lowest point red bar half way on the screen) on the chart below (Fridays EURUSD, I made 108 pips although if I'd stayed in longer I could have been over 200!) - this is screaming to me as testing suppy by the market makers - do you agree?
The previous two bars (these are 5 minute bars) have below average volume down bars, and then suddenly we've got a over double the previous...
Ignored
eu more down i think , after a 350 pip drop we need to see a retracement to entice more sellers , however looking at a 60 min certainly sellers right now and not much in way of buyers
The red bar (climax) looks like standard stopping volume in VSA. Which I find are some of the easiest signals to spot and enter on (open of new bar)
I would not try to read too much into the late NY volume on Fridays as it's usually profit taking and lower than average volume at the end of the week.
/me waits for Malcolm to yell at me.
I have to say like most of you reading this thread I am learning as well. I would like to thank everyone for their inputs both here and in chat because even when you are wrong you learn.
See you all...
Ignored
well shamus es I expect break under 800 , gj a move to 135 ... so ej I think should move into 125ish
,, the reversal doji on friday after an upthrust doji looks like top is in for ej for a while
Notice the increase in volume at the pivot bar with the SM selling at this point.... enter on close of the bar marked yellow and exit on the 2nd marked bar when professional buying arrived.
This how I read this but would appreciate comments ?