Attached is the daily S and R for AUDUSD which can be used for the forthcoming week...these are on the daily charts and are hence quite strong...
Ignored
Hi ns_karthik,
Thank you for a nice and simple system. I have read through the thread and i could like to get some clarifications.
1. You talk about price action on the S/R. Which type of price action do you look for at those areas eg pin bar, engulfing candles, doji etc
2. You said that when price has broken through a R or S you just watch the price for 10-15 min to see whether it stays above or below it before entering.Is that the case?
Then what about bouncing off a R or S area do you wait for the 10-15 min to see whether it breaks or not?
3. If the price breaks the R/S and it stays above it for 10-15 min and in the next higher TF there's a R/S which hasnt been broken, do you take the trade or you just let it go.
4. You said that you dont wait for a candle/bar to close before entering a trade, but the staying above/below R/S is what determines your entry. Then it means that somebody like me who discovers the system today(i saw it yesterday) will not be able to go back and see what you did when you were trading on 23rd with live trades.
If possible you can use that days charts either the GJ or EJ chart and use a 1 min or 5 min chart to explain a bit.
Sorry for the long post but i need to understand your system.
I'll appreciate your response. Nice weekend.
Many of you, by now, should be having a trading plan or system. If you dont,then you must be pretty new to trading. So you better get a system for yourself as soon as you can. If you dont, the law of averages would soon catch up with you and you will soon start losing money. Your system or plan can be anything but the biggest thing here is sticking to your plan.
You have developed a great trading system which you find that works 70% of the time. It is on a 1H timeframe and you usually get signals every day. So now what happens? You get a signal....
Ignored
110% agree with that...perfect, clean and a must-read and/or follow road map just hanging there...
all newbies and even experienced traders..that'd be the best thing to do reading what this guy just said everyday over and over again until you feel and start living that the fact what he pointed out..
Hi ns_karthik,
Thank you for a nice and simple system. I have read through the thread and i could like to get some clarifications.
1. You talk about price action on the S/R. Which type of price action do you look for at those areas eg pin bar, engulfing candles, doji etc
2. You said that when price has broken through a R or S you just watch the price for 10-15 min to see whether it stays above or below it before entering.Is that the case?
Then what about bouncing off a R or S area do you wait for the 10-15 min to see whether it breaks or not?...
Ignored
thanks for ur questions, mate...keep them coming...
1. i dont look for any specific price patterns around SR areas...i love the pin bars though....pin bars on the 4H and 1D charts where they penetrate thru a S or R and then fall back are the best indications of a sure shot move....but i really dont look for any specific patterns....as i keep saying, i am a scalper.....first, i generate a 'feel' for the market ...this is developed thru experience....i try to find the overall trend of the market...that is an absolute must...once i get the overall trend, i usually prefer to wait and establish a trade in the direction of the trend....if i do take a counter trend, it is only for 5-6 pips just for the heck of it...otherwise, i just watch out for a hold or break of SR and trade accordingly...
2. yes i do wait in the case of bounce....but if the bounce is in the direction of the overall trend, i dont wait but i just take a trade on the hit of the SR...for eg. , if the overall trend is bullish, i take a trade when price nears a support and i dont wait to verify whether the support is holding or not....reason is, there is a huge chance that the supports will hold rather than break in a bullish trend...vice versa for resistances and bearish trends...
3. usually as far as i have seen in MM, the consecutive supports (or resistances) in 1H or 4H and 4H or 1D are atleast 80-100 pips away from each other (i dont trade any lesser timeframes and i usually trade the most volatile pairs)....so i have not faced a situation that u have mentioned yet....but if i did, i guess i would not take a trade against the higher TF SR...
4. i will explain these trades shortly.....i guess i have a lot of things to explain...just dont get the time to do it...will do so sometime today or max by tomorrow....
110% agree with that...perfect, clean and a must-read and/or follow road map just hanging there...
all newbies and even experienced traders..that'd be the best thing to do reading what this guy just said everyday over and over again until you feel and start living that the fact what he pointed out..
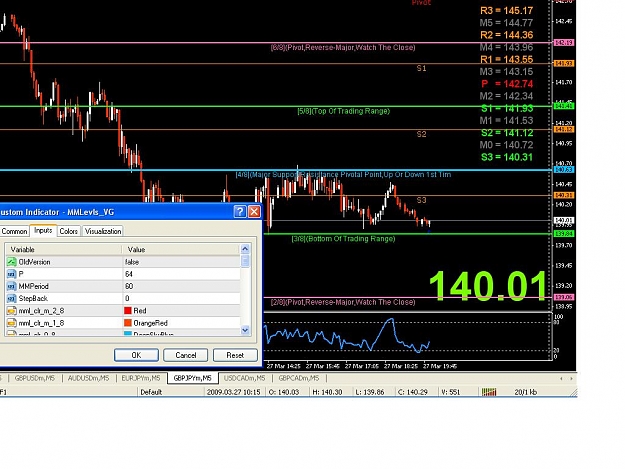
attached is the 1H chart for GJ with the MM levels...now concentrate on the price and SR on 27 March, namely 2/8, 3/8 and 4/8 prices which are respectively 139.06, 139.84 and 140.63......keep these price levels in mind....next post i will show the 5 M chart for the same time period and will try and explain how i would have taken the trades....i do know that its easy to explain in hindsight but as i had showed a few days earlier, i have done some live trading as well on this thread for almost one full day....
i trade using only the 1H charts....sometime i look at higher TFs to know stronger SR....
here is the 5M chart for the time period when the price moved between 139.06 and 140.63.....
at the left of the chart, u can see that the price dropped from around 140.30 and within 30-40 mins has reached our big support at 139.06....in the middle of this move, there was stalling at around 139.55, then a move back to around 140 and then down we came again to reach the support (2/8 level on the 1H chart) at 139.06....
so why did this stalling at 139.55 take place and why did this move back into 140 take place?? as seen at the left of the chart, the price was ranging around 140.3 and then there was a break out move downwards and it broke the support at 139.8 (3/8 level on the 1H chart) and pushed thru to around 139.5....as i had mentioned in one of my posts, when there is a strong and quick break of any SR, 80% of the time , price will come back to the SR point (maybe even overshoot it a bit) and then it continues its move...this is a false retracement to clear out any buyers/sellers and it is usually done by big guys who have missed the sudden move thru the support....this is what happened here....the support at 139.8 broke thru quickly and reached 139.55....then price retraced back to the support (139.8) and a bit more (140.1)...when this happens, that too quite slowly (5-10 mins), u can be sure that the support has been broken and that the fall is going to continue again...so u can take a short at the retracement to 140.1....this is a very safe short as the high of this move is at 140.30 which means that u r risking only 20 pips.....
as u can see, the retracement did not last long, and the price continued down thru the support at 139.8 and it came down to the strong support at 139.06 (2/8 of 1H chart)....at this point, u can safely exit the short taken at 140.1 and wait to see if this strong support is broken...as u can see, price stalled here and this stalling continued for 5 - 10 mins (2 bars)....this increases the chances that the support would hold....so again, we take a long when price comes close to 139.1...this is a safe long with risk of only abt 15-20 pips....as a scalper, u could exit the long with 10-20 pips or wait...
in this case, waiting would have been prudent as the price zipped upwards, broke thru the support turned resistance at 139.8 and went right uptil the strong resistance at 140.63.....this waiting was beneficial this time but it may not be so always.....so u need to keep a close watch on such longs...
so u could have entered a long at 139.06 or waited for breaking 139.8 and taken the long....again, 140.63 proved a strong resistance...price stalled there...so u take a short there with low risk, watch it carefully and u can see that u could have made pips on that as well as the price moved down to 3/8 level on 1H chart which is 139.80....
so likewise, from left to right, u can see that the price kept moving between 140.6 and 139.8 (4/8 and 3/8 of 1H chart)...so all that u had to do was wait for price to reach near one of these levels, take a long or short with low risk, watch for price stalling and retracements and keep playing....
u need guts, u need confidence and u need to believe in the charts...dont think...do what the charts tell u...this guts and confidence comes with good money management where losing 50 pips is pittance for u and it does not alter ur account by much...so that gives u the confidence to take atleast the low risk trades....
so if u had caught most of the moves from left to right, u could have easily made more than 300-400 pips in 7 hrs....thats just a normal days work !!!
edit - u can also see that 140.3 which had served as resistance at the beginning of this entire move (left of chart) has also served as support during the middle of the move (middle of the chart)...u need to learn to watch all these small things....its like driving a car...initially u r overwhelmed by the amount of info and the fact that u have to watch out for so many things....but as u keep doing it and once it becomes a practice, all this becomes a habit and u do all these watching automatically and easily without u even realising it.....
Many of us, when we start out trading try to look for short cuts tosuccess in trading. And one of the easiest ways to make money seems liketo go for EAs (short for expert analysers). So what are EAs? EAs are programs which are written to trade automatically. They are mainly used in MT4 platforms but now many other platforms have started supporting programs for auto trading.
So how does this work? You can program your trading platform to buy or sell under certain conditions. The conditions can be anything. It can be as simple as 'buy if price goes below 1.1000' to something as complicated as 'buy if 10 ema crosses 13 ema and MACD value is 1' or whatever. The indicators used in your platform can be called as functions by the program and parameters can be passed to it, indicator values can be returned for the parameters passed and then a buy or sell can be executed. It can also be programmed to give a audio or visual alarm when the trading signal appears.
The EA is the height of automated and mechanised trading. Nothing can beat it. No human intervention is required and everything happens mechanically. This has both its positives as well as negatives. The biggest positive is the emotional turbulence and hence the confusion of a human mind in trade is avoided. Since there is no human intervention,errors like seizing up when a signal is there cos you are too scared,taking profit early, refusing to execute a stop loss cos you somehow feel that the position will come back and other human errors born out of emotion can be avoided. The negative of this is the same as the positive. Just as being mechanised totally is good in a way, likewise,too much automated trading is not good. Whenever a signal is generated,there needs to be an analysis of the background of the signal, the market conditions, market sentiment etc before you enter a trade. Blind following of the signals will eventually lead to a huge loss.
Enter any discussion forum and you find that there is a huge demand for EAs. Why? Cos people are lazy. They just want to sit back and relax while all the money is made automatically by the EA. But they fail to realise that nothing in this world comes easily, without doing any work.Nothing wrong in using an EA but atleast an effort should be made to understand what is happening in the EA, how it works, when it works,when does it not work. etc. No EA will work under all conditions and at all times. So a thorough study of the EA needs to be made to understand what happens in the background so that the EA can be correctly controlled at important points of time so that its power can be utilised to the maximised extent.
My request to all new traders is to spend some time in forex. Spend sometime understanding how forex works, how the market works, how the indicators work, how the trading systems work, how EAs work etc. Spend lot of time studying. Nothing in this world is got freely without hardwork. There are no freebies in this world. If it looks like one, then it surely aint. So work hard, sweat it out, learn it the hard way. That is what will make you consistently successful.
there is a pin bar in the weekly of EJ.....it is bearish...it broke thru the previous high and then came back down to finish below the high...looks good for a short which would last for 1-2 weeks...GJ might follow....with the stock markets following EJ and GJ a bit (they used to be very much interrelated sometime back but not so now), we could be in for a bearish trend in all markets over the next 1 -2 weeks...
thanks sivaji....i am also working on something which will also tell us the time when a trend change will happen...if that could be predicted , that would be awesome....this is also done using MM....
nice drop for GJ from the hourly support at 139.8.....now close to strong support at 139.06...i expect a bit of bounce from here but it would be still bearish...sell rallies....
there is a pin bar in the weekly of EJ.....it is bearish...it broke thru the previous high and then came back down to finish below the high...looks good for a short which would last for 1-2 weeks...GJ might follow....with the stock markets following EJ and GJ a bit (they used to be very much interrelated sometime back but not so now), we could be in for a bearish trend in all markets over the next 1 -2 weeks...
Ignored
so the week has indeed begun with all round bearishess in GJ, EJ and the asian stock markets as well....
did not expect the bounce to be so small...expected a bigger bounce than that...anyway, took short on gj from 139 and took TP at 138.70....short on EJ from resistance at 129.70 and took TP at 129.28....