tcmmHere is a Tip When you want to know how long a Daily Bar will go. Put your ATR on the chart and Set it to 5, when you touch the bar with your cursor you went in on, this will show how much that bar will roughly make in pips to guide you.
Hi tcmm,
I have added the ATR 5 to my charts.
When I touch the bar with my cursor, it's not showing ATR,
only the open, high, low, close, volume.
What am I missing?
Please explain your SL and TP.
Do you to take profit everyday?
Thanks
Ignored
Stoploss is lowest bar low 3 bars back if up and highest if down trend
Take profit 1 Day ATR which is set at 5
Then Exit 1/2 the position Let the other Run and tail the stop 3 bars back moving it every night at new bar.
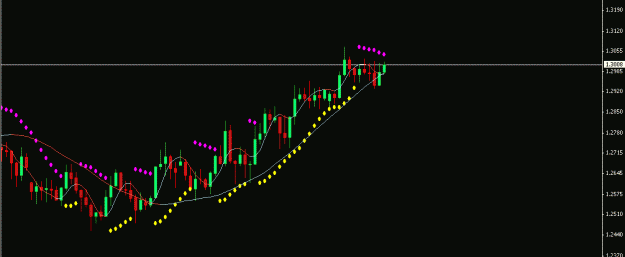
Guys look at the usd/jpy I went in at 98.08 on Sunday ngiht its now at 98.80 the ATR 5 on Sunday said 105 pips I am up 72 pips 1/2 position take profit is set at 99.05 then I will let the other 1/2 run til I get stopout with my rule of 3 bars back Stoploss.
Pull up the USD/JPY Daily and you will see this. The 2 Slopes are in line after the Retracemnt. Good way to see this clear.
[quote=tcmm;2609362]They are set at 13 RSI both
One 55 and 45 levels and the other 50 levels
Its a guide of trend Direction for Dailies[/quote
Hey tcmm Meta trader4 RSI comes with a line indicator instead of bars. Where can we get the CUSTOM RSI Indicator at or could you post yours for us......Richard
They are set at 13 RSI both
One 55 and 45 levels and the other 50 levels
Its a guide of trend Direction for Dailies[/quote
Hey tcmm Meta trader4 RSI comes with a line indicator instead of bars. Where can we get the CUSTOM RSI Indicator at or could you post yours for us......Richard
just tried your 80/12 slope system on a eurusd 4h chart. Looks rather interesting.
Ignored
If you want you can trade off a timeframe but always make sure you check 2 lower frames IE: -Monthly is Trade Chart-Check Weekly and Daily.Make sure Slopes are same coluor.
Weekly is Trade Chart-Check Daily and 4Hour
Daily is trade Chart-Check 4Hour and 1 hour
And so on.
But the method is better on Daily less time on computer and more steady pips
Ignored
Thank you for the reply.
I checked your MACD settings 12-20-9 , they are very unique. Can you please tell me the logic behind?
Where was that macd settings from? I didn't have a macd
Ignored
Maybe was someone else wtih the same name.
1) Open a 1hr and a 15min. charts
2) Put a 200ma on the charts
3) Set and put a MACD 12-20-9 Crossed same direction as 200ma both charts
4) Stoch at 8-3-3 Just to show Overbought and Oversold only
5) Pivots to guide you
6) 5ma close and 8ma open When they cross
7) When both charts have 200ma same trend and MACD cross the same and the 5 and 8 cross Buy the dips in an uptrend,
and sell the rallies in a downtrend.
I am going to go and have dinner any questions post them.
Look how nice that USD/JPY is doing Daily I am still in from 98.08.
I posted the chart earlier.
I am going to go and have dinner any questions post them.
Look how nice that USD/JPY is doing Daily I am still in from 98.08.
I posted the chart earlier.
Ignored
hey Tcmm,
can you post all the rules with your new system with the template that you just posted ? i am looking at it as i am typing this .. also if any other indicators we need ..