When do you turn off the ea? Do you "let it ride" over the weekend? I'm assuming you use all 23 pairs. Is that right? I also would like to know how many sl's you've had (500 pip drawdown).
Ignored
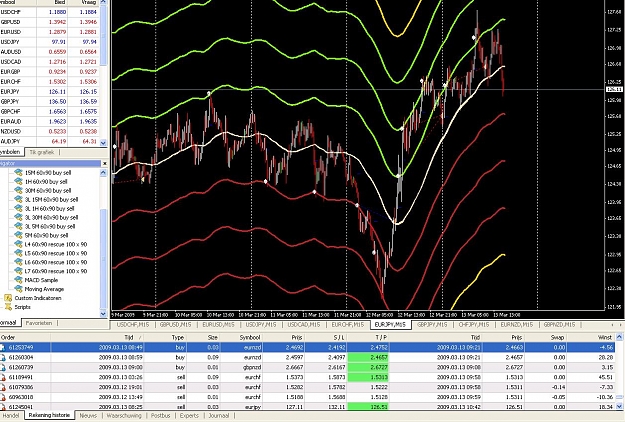
Jt, I don't turn this ea off, I do let it ride over the weekend. I only use the pairs you can see from the screen shot. I have not had a 500 dd yet. I see my gbp/usd closed with profit but was replaced with a couple other death trades. My equity went up a 1000. I'm just letting it ride. No manual anything. I see I've only been to the 3rd level 8 times during the 3 weeks including the 2 that are still active. May cut pairs down to 3 or 4. If it keeps testing positive will probably be live in a couple weeks with 1000 playing for dimes or pennies. Will keep you guys informed.
Joined Jan 2008
|
Status: Inertial Member
|2,297 Posts
What we need is an accurate statistical distribution about
the maximum swingsize and the maximum pullback within the swing.
So how many times does it leave the MA for 100 Pips and Reverses
10 Pips more, 20 Pips or more etc etc.
Otherwise everything is just guessing. Only if we know
how deep the swing is most likely to be and how deep it's most likely
to pull back in that swing we can optimize our Level Distance and Lots
to maximize profits. I will try to get this done.
The problem here is that we need tick data for this one. If you look at the
candle chart alone it may look like price rocketed up 50 pips in one candle but
it could be that it has retraced 10 pips withing the candle before it closed.
What we need is an accurate statistical distribution about
the maximum swingsize and the maximum pullback within the swing.
So how many times does it leave the MA for 100 Pips and Reverses
10 Pips more, 20 Pips or more etc etc.
Otherwise everything is just guessing.
Ignored
You are right. This data is very essential for this system. We have arrive at optimum TP for every pair and select other parameters based on that.
It will be interesting if you can obtain this data.
Tipid, I agree with you 100%. If that information was easily obtainable, the pairs could be more closely defined. My guess is that this sort of data can only be obtained through painstaking manual checking back over the past year or so.
What we need is an accurate statistical distribution about
the maximum swingsize and the maximum pullback within the swing.
So how many times does it leave the MA for 100 Pips and Reverses
10 Pips more, 20 Pips or more etc etc.
Otherwise everything is just guessing. Only if we know
how deep the swing is most likely to be and how deep it's most likely
to pull back in that swing we can optimize our Level Distance and Lots
to maximize profits. I will try to get this done.
The problem here is that we need tick data for this one. If you look at the
candle...
qz; how many trades you done in total and what is your win loss ratio please?
Ignored
I'm counting a system win as winning on the first level, second or third level. So I've had 57 consetive wins and no losses (100%). 36 wins on the first level, 15 on the 2nd level and 6 on the third level. This is right out of the box no manual anything. I'm actually trying to lose the system on the six pairs I'm trading, would like to have 3 pairs to trade live.
I am following this threat from the beginning and I decided to set up a few demos last week and guess what de most "dangerous" setup had by far the best result. It went up about 100 % (ibfx). I thought it would gone bankrupt. The more defensive setups are losing money... I have to say I think the ibfx demo is not getting all the right action, because it missed some of the chf rubbish of this week. The other demo's are on alpari with an adjusted EA.
I'm trading usd/chf, gpd/usd, eur/usd, usd/jpn, usd/cad, eur/chf, eur/jpn, gpb/jpn, chf/jpn, eur/nzd, gpd/nzd all on 15 m TF.
See the attachments for all the statements
Anyone any suggestions ? (There's also a detailed pdf)
Tipid, I agree with you 100%. If that information was easily obtainable, the pairs could be more closely defined. My guess is that this sort of data can only be obtained through painstaking manual checking back over the past year or so.
Ignored
I was experimenting with a free statistical program called Gretl. Trying to figure out the range for the 1 hour time period, then using that software to get the frequency. I'm not sure if those are the parameters we need or not.
As an example, I was using Aud/Cad 1HR data. From Metatrader, I was able to get 2048 datapoints back to November 5, 2008. I calculated the price range per hour. From there, I imported that data into Gretl and calculated the Frequency. Here's what I got. I'm very rusty on statistics, but if could put our heads together, maybe we can figure out the correct model/variables to test for and get this software to plot the highest probabilities for retracement. Once we have it done for one currency pair, then we could try the others. Below this is a link to get historical data back to 2004 from Alpari. They have 1 min and 1hr data.
Interesting data. There were some definite breakpoints. 98.58% of the time, the pair moved less than 100 pips in 1 hour. 92.58% of the time, it moved less than 71 pips. 25% of the time it moved around 30 pips. That was the highest frequency. Please comment what you think.
Field
--------------------------------------------------
Results from Gretl (statictics program)
Frequency distribution for HourRange, obs 1-2048
number of bins = 29, mean = 45.6895, sd = 20.9869
You can download historical inter-bank data that will improve your back test results as you will have access to ‘1 minute’ and ‘Daily’ data that stretches back to 2004.
By downloading additional data you will be able to increase the accuracy of your technical analysis and potentially be able to make better trading decisions.
What I was looking for was/is a way to determine how many pips a pair went up, over any time period, whether it be an hour, a day or a few days before it retraced by about a 60-100 pips. If we had that sort of data, we'd get a handle on the extremes that a pair has gone up in the past before a retrace of 60 pips, 80 pips, 100 pips. That could be used as a guide.
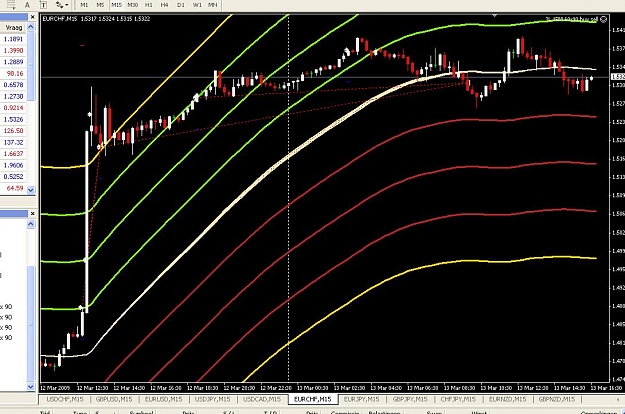
You got me, Jarrod. One thing I notice is that you got real lucky on the EUR/CHF in that your retrace was almost exactly what you needed. Had it not been, you'd be down quite a bit on that pair. Maybe on a live account, that wouldn't have happened.
[color=black]I am following this threat from the beginning and I decided to set up a few demos last week and guess what de most "dangerous" setup had by far the best result. It went up about 100 % (ibfx). I thought it would gone bankrupt. The more defensive setups are losing money... I have to say I think the ibfx demo is not getting all the right action, because it missed some of the chf rubbish of this week. The other demo's are on alpari with an adjusted EA.
What I was looking for was/is a way to determine how many pips a pair went up, over any time period, whether it be an hour, a day or a few days before it retraced by about a 60-100 pips. If we had that sort of data, we'd get a handle on the extremes that a pair has gone up in the past before a retrace of 60 pips, 80 pips, 100 pips. That could be used as a guide.
Ignored
I think the data is there, we just would probably need to figure out the direction, manipulate the data to determine the direction, and then do some comparisons between time frames. I'm not a statistician so not sure exactly how it would be done. This program is really powerful for a free statistics. We just need to come up with the rules we want to apply.
That would be something I would want. I realize past history is no guarantee it would be the same in the future, but it's all we have to go on. I know that Nannigbob has previously reported his findings on the most that pairs have gone up in a day. What I would like to know is what's the most a pair has gone up without a retrace of XX no matter if it's one day or more.
I think the data is there, we just would probably need to figure out the direction, manipulate the data to determine the direction, and then do some comparisons between time frames. I'm not a statistician so not sure exactly how it would be done. This program is really powerful for a free statistics. We just need to come up with the rules we want to apply.
[color=black]I am following this threat from the beginning and I decided to set up a few demos last week and guess what de most "dangerous" setup had by far the best result. It went up about 100 % (ibfx). I thought it would gone bankrupt. The more defensive setups are losing money... I have to say I think the ibfx demo is not getting all the right action, because it missed some of the chf rubbish of this week. The other demo's are on alpari with an adjusted EA.
Joined Jan 2008
|
Status: Inertial Member
|2,297 Posts
The dilemma is that we do not know how many levels we will need
for the next swing to get a near 99% chance to get out with profit from a
pullback. If you build 100 levels you will probably get 99,9% success. There has to be a point where it's not optimal to distribute more money on extra levels but rather increase the lotsize of the first levels.
Jt, I don't turn this ea off, I do let it ride over the weekend. I only use the pairs you can see from the screen shot. I have not had a 500 dd yet. I see my gbp/usd closed with profit but was replaced with a couple other death trades. My equity went up a 1000. I'm just letting it ride. No manual anything....
Ignored
I'm curious what led you to choose those pairs. I'm surprised that six pairs could create so much action in a month.
Jt, I don't turn this ea off, I do let it ride over the weekend. I only use the pairs you can see from the screen shot. I have not had a 500 dd yet. I see my gbp/usd closed with profit but was replaced with a couple other death trades. My equity went up a 1000. I'm just letting it ride. No manual anything. I see I've only been to the 3rd level 8 times during the 3 weeks including the 2 that are still active. May cut pairs down to 3 or 4. If it keeps testing positive will probably be live in a couple weeks with 1000 playing for dimes or pennies....
Ignored
One note of caution: the FX markets have been rangebound and ideal for this kind of trading in 2009. I've noticed a renewed interest in various Martingale/grid systems on another forum. Unfortunately, I tested several and all either blew accounts or were net losers in 2008.
Can this system survive the huge moves we saw last Fall? I'd look at those conditions as a worst case scenario--along with more stable, steady trends like the EURUSD's upmove from mid-2006 to 2007. Don't expect the future to keep looking like the last few months....
What I was looking for was/is a way to determine how many pips a pair went up, over any time period, whether it be an hour, a day or a few days before it retraced by about a 60-100 pips. If we had that sort of data, we'd get a handle on the extremes that a pair has gone up in the past before a retrace of 60 pips, 80 pips, 100 pips. That could be used as a guide.
Ignored
I've been looking for that kind of information (max. movement in one direction before a given retracement ) for 3-4 months. I do know that Bob's 100/40 EA,trading it on the EUR/USD only, hasn't gone more than 13 levels (520-550 pips) without a 100 pip retrace since Oct. 26th. I've traded $3000 to almost $4600 since that date using 1.5 mult. starting at .02 lots. And for what it's worth, the strategy tester shows these settings survive the early October chaos.
I've been looking for that kind of information (max. movement in one direction before a given retracement ) for 3-4 months. I do know that Bob's 100/40 EA,trading it on the EUR/USD only, hasn't gone more than 13 levels (520-550 pips) without a 100 pip retrace since Oct. 26th. I've traded $3000 to almost $4600 since that date using 1.5 mult. starting at .02 lots. And for what it's worth, the strategy tester shows these settings survive the early October chaos.
Starting at .02 and doubling each time? At 90 pips from center?
Ignored
parad, No, it's Bobs trend following EA that buys above the 2MA and sells below the 2MA. It's in the " is this my holy grail ea" thread, several pages in.