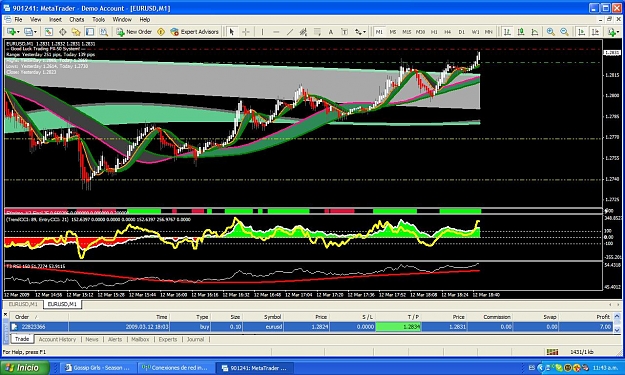
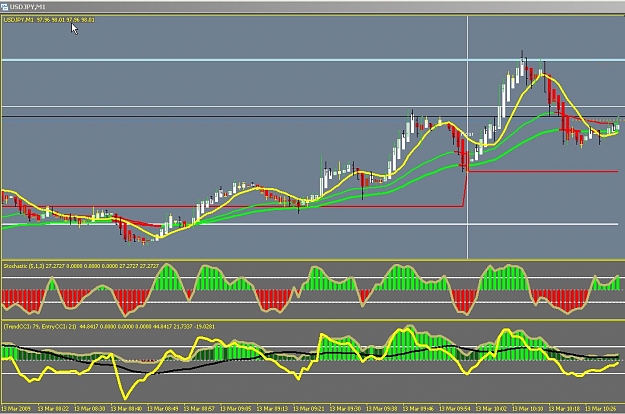
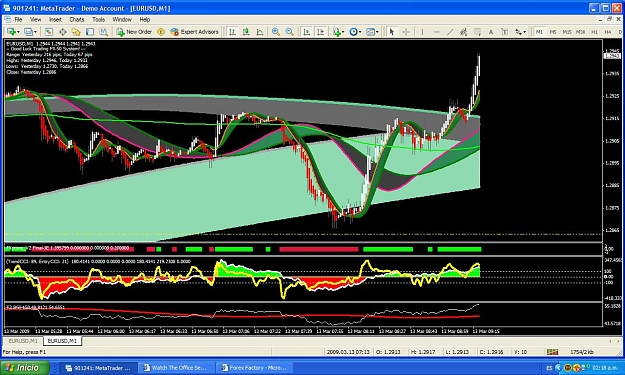
The fact that all TF ribbons are underneath at the spots where you have put the red arrows...... means that the traders on all those TF's still are divided in what to do when price comes down. Indeed there is a double top....
So some will say: Price comes down.
If you look closer you see that the other TF ribbons are underneath.... therefore price has to break through..... The question is: "Will the traders on these TF levels start selling or are they going to hold positions?" In that case price bounces and may go zig zag until it has a chance to breakout above or below all the ribbons >>>> Than you have another trade opportunity.
So the rest of the chart says: This is not a High Prob Trade
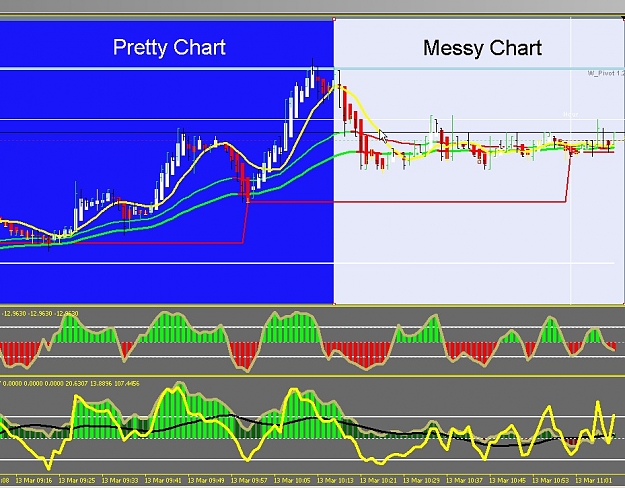
B.T.W. You mean it's a triangle which is narrowing I suppose? That means resistance >>> so it's the first sign that price has difficulty to go down in one line. It may go down at first when the ribbon is a bit wide, however price will come up first and maybe do anther try to go down. We don't go down these messy roads... we preferably take the Highway right into open space...
Only when price is going into wide open black space...... All traders agree to where it's going. The only thing you still have to consider in such cases are nearby Pivotlines and Fiblines.... Price has to cross those too.
The next Pivotline or Fibline...... in open space.... most likely now is the target where price is heading.
Look for all the examples in the pages starting as of page 100 upto this page. Study those over and over again !!!
Good Luck, John
So some will say: Price comes down.
If you look closer you see that the other TF ribbons are underneath.... therefore price has to break through..... The question is: "Will the traders on these TF levels start selling or are they going to hold positions?" In that case price bounces and may go zig zag until it has a chance to breakout above or below all the ribbons >>>> Than you have another trade opportunity.
So the rest of the chart says: This is not a High Prob Trade
B.T.W. You mean it's a triangle which is narrowing I suppose? That means resistance >>> so it's the first sign that price has difficulty to go down in one line. It may go down at first when the ribbon is a bit wide, however price will come up first and maybe do anther try to go down. We don't go down these messy roads... we preferably take the Highway right into open space...
Only when price is going into wide open black space...... All traders agree to where it's going. The only thing you still have to consider in such cases are nearby Pivotlines and Fiblines.... Price has to cross those too.
The next Pivotline or Fibline...... in open space.... most likely now is the target where price is heading.
Look for all the examples in the pages starting as of page 100 upto this page. Study those over and over again !!!
Good Luck, John
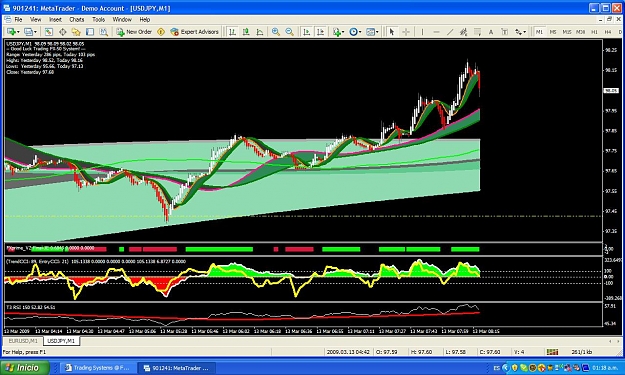
DislikedI cant remember who started talking about these but I started seeing them after reading about them. So here is an example of what I am asking a question about. Are these High probability trades?
Notice double tops at the two red arrows, and the diverging ribbon, then we get a big move down and some hesitation at one of the pivots. Next we get a move up that stalls and cant set a new high and a doji which is my confirmation/entry (blue line). Notice that that moves ends at the moment at the low ribbon.Ignored