Dislikedeither am dead in the water or we are in for a major raLLY--LONG eurusd
i still haven't given up on the way you trade VSA--NYSE1982---haven't seen you in the forum today
hAVE SOME QUESTIONS FOR YOU--Ignored
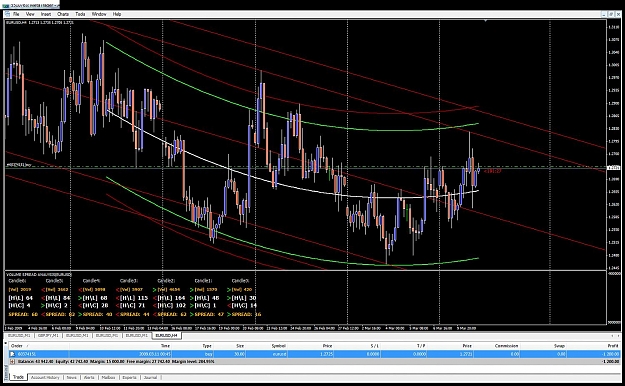
CANDLE 6
H/L64
H/C4
SPREAD 60
this is saying that the trend is moving up nicely, steady spread and good volume,not to extreme.
CANDLE 5
H/L84
H/C2
SPREAD 82
the trend is still moving up nicely and spread is good.
CANDLE 4
H/L68
H/C28
this I call the alert bar and if you look at all the other charts I post youll notice this pattern. Decrease in spread, increase dramatically in volume. Also your H/L has decreadsed meaning less buyers and H/C increased more sellers are in, which tell you of a pending change.
CANDLE 3
H/L115
H/C71
thats the trap, the smart has trapped you on an upbar, if you pay close attention notice that volume is way to extreme, and your H/L and H/C increased dramatically telling me more sellers are coming in and if you went long you need to be getting out.
CANDLE 2
H/L 164
H/C102
SPREAD 62
okay this is the strong downmove but notice that spread is extremely high for down move, its supposed to be gradual on a true follow thru down move.
CANDLE 1
H/L48
H/C1
okay this tells me that the H/L decreased over 100% which means next bar should be weak, b/c not only are most of your buyers gone, you have hardly any volume to support this upmove..
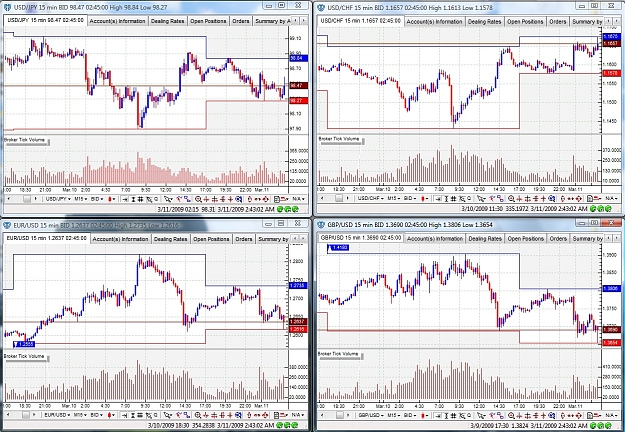
Just a cautionary note also be aware that when you trade higher timeframes your stop loss also has to be much higher, as you can see from the tails on these bars. Thats another reason I don't trade higher time frames is b/c of the issue that your exposed to alot more risk on hightime frames. If you do trade high time frame please trade using smaller lots only!
Attached Image (click to enlarge)