Well I've been analyzing the 4HR and 15m charts and we have confirming signals. On the 4hr we have Candle...
Ignored
In my own humble opinion,i think we can spice up the efficacy of vsa by adding simple tools like trendlines and bollinger band.Then switching from a central time frame to the next higher and then next lower time frame respectively.For instance if the upper bollinger band is touched by price on hourly chart and the lower band is broken on 5min chart,then i think any reduction in volume in a rising market on 15min chart is a good sell signal. Alternatively,if price hits the falling trendline on hourly and breaks down the rising trendline on 5min chart,then i equally think any reduction in market volume in a rising market is a good sinal to enter short trade on 15min chart.Well,i think iam close to the point.thanks
[/left]
we cannot succeed without a well defined risk management.
Many arguments arose on the application of vsa to forex trading.To a great extent,the opposition group established their reasons on the basis of decentralized nature of the forex market.They therefore claim that vsa cannot work in forex since each broker presents market volumes at any one time relative to the transactions on their own platform.To an appreciable degree, this is true.However,vsa relies on variations within market volumes and within price spreads.Even though there is inconsistency in the market volume from one broker to another at...
Ignored
other option is spend the cash ion esignal GTIS feed .. 300 sources on a single feed and representative of volume in market as whole....
Thank you all for your contributions.Please let us continue to cross-fertilize ideas until we arrive at a highly reliable trading system in connection with vsa.I will like to rest before the market kicks off.Regards
we cannot succeed without a well defined risk management.
|
Joined Sep 2005
|
Status: pip my ride
|507 Posts
There's also a lot of other free ebooks/articles on that site. For forex - just type "forex" in the search bar. Thanks shamusfamous for mentioning it - it's a shamus I didn't find out about it sooner.
background says there is pro selling in this upper area ... we have seen end of a rising market followed by reversal after effort to rise. I would be very hesitant to buy any breakouts of this area to upside with those signs in the background on a 15 min chart
Great to see this thread I see its got lots of great energy.
My own interests have been in how volume increase can signify a breakout from a consolidation/ range. I have also considered using ATR to determine the health of a breakout and like to look at how a 10% change in daily ranges of vol/atr which to my mind indicates liquidity... just my ideas, but may I enclose a link to an SFO article :Frozen in Analysis Paralysis? Use Volume to Break Through the Ice by: Todd Krueger
Many arguments arose on the application of vsa to forex trading.To a great extent,the opposition group established their reasons on the basis of decentralized nature of the forex market.They therefore claim that vsa cannot work in forex since each broker presents market volumes at any one time relative to the transactions on their own platform.To an appreciable degree, this is true.However,vsa relies on variations within market volumes and within price spreads.Even though there is inconsistency in the market volume from one broker to another at...
Ignored
Well established analogy..couldn't have said it better myself..I think blackwolf is gone to agree with this one
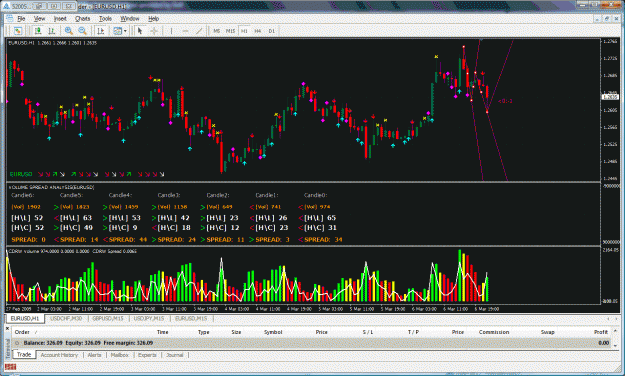
Well lI pulled up that chart and based on that last candle it looks as though we'll have a up bar..that spread on candle 0 is extremely high compared too the previous bars..I see we have a slight wave pattern forming from that last bar..I wouldn't be surprised if we see a continuation of that zigzag.However any up move would be short lived..What do you suggest? I'm looking at going long
Well lI pulled up that chart and based on that last candle it looks as though we'll have a up bar..that spread on candle 0 is extremely high compared too the previous bars..I see we have a slight wave pattern forming from that last bar..I wouldn't be surprised if we see a continuation of that zigzag.However any up move would be short lived..What do you suggest? I'm looking at going long or short?
Well lI pulled up that chart and based on that last candle it looks as though we'll have a up bar..that spread on candle 0 is extremely high compared too the previous bars..I see we have a slight wave pattern forming from that last bar..I wouldn't be surprised if we see a continuation of that zigzag.However any up move would be short lived..What do you suggest? I'm looking at going long or short?
Ignored
I wouldn't waste any thought on orders just yet. It will likely gap as is often the case on Sunday so... Wait for the market to tell you.
Hello,
I alwais looking for volume and price action
i found this interesting thread one week ago and i want give a little contribution maibe can help some one.
i add one indicator for who use ninja platform.
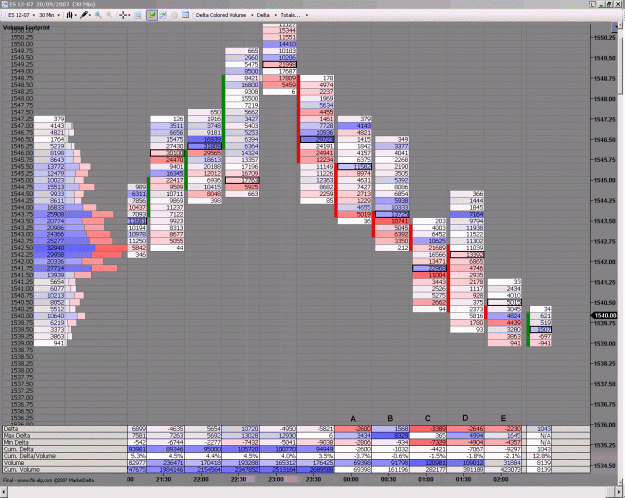
Footprint chart will show you volume,bid/ask,delta on every candle also it show you key levels form by volume.
In zip file you will find installer indi and will make you able to test for 1 month enjoi.
oh!! i know alex thread and he show volfix chart that show volume at some levels
This is a indi for free ninja platform that i found surf on google and i start to test only on friday and is very helpful because can show you bar by bar not only volume but bid/ask and delta that if you can work only whit vol and price action it can help you to much.
Nothing betwen alex and this thread wotewer i sad maibe can help if not peace....
Ignored
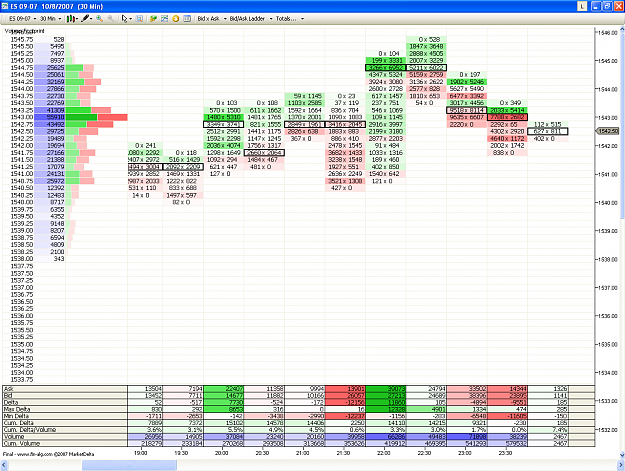
I have tested it and also volfix, and imho it's not so useful for currencies trading as it is for stock and releted futures, where u can see the true order flow that move the price.
Hello,
I alwais looking for volume and price action
i found this interesting thread one week ago and i want give a little contribution maibe can help some one.
i add one indicator for who use ninja platform.
Footprint chart will show you volume,bid/ask,delta on every candle also it show you key levels form by volume.
In zip file you will find installer indi and will make you able to test for 1 month enjoi.
Ignored
market footprint is very different from vsa..... still to do with volume , but volume is used in a different way in the footprint. I used marketdelta.com for a while to trade futures
You know what would work best if we all work on a specific pair, so we can have better organization to the forum..Malcolm you seems to specialize GBP/JPY so can you let the room know when you see a setup..I'll handle EUR/USD and we can delegate the pairs out to members..Malcolm can you handle EUR/JPY also, I notice it pretty musch moves in tandem with the GBP/JPY?
Hello,
I alwais looking for volume and price action
i found this interesting thread one week ago and i want give a little contribution maibe can help some one.
i add one indicator for who use ninja platform.
Footprint chart will show you volume,bid/ask,delta on every candle also it show you key levels form by volume.
In zip file you will find installer indi and will make you able to test for 1 month enjoi.
Ignored
thanks for this.... messing with it ... looks good for forex .. one of my beefs with marketdelta is they could not get tick vol for forex ....