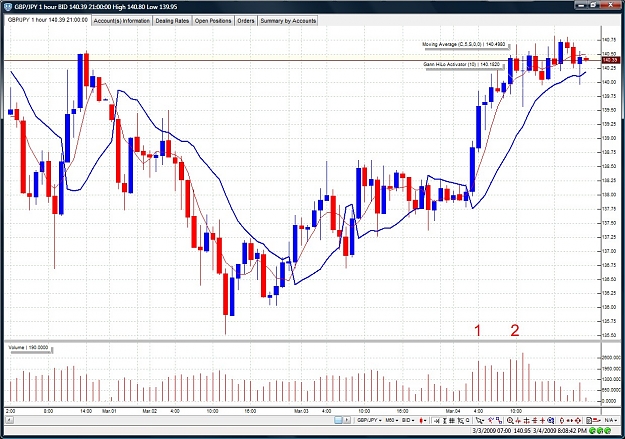
Here's a 1H chart with a volume indicator at the bottom. During the second hourly candle of the upmove, volume spiked (see #1). I looked back through the chart and it was the largest volume spike I have. A few hours later during early NY, 3 more large volume spikes occurred (see #2) which were larger than the first.
If anyone cares to analyze this and the associated PA at the time, it might help some of us understand it better.
If anyone cares to analyze this and the associated PA at the time, it might help some of us understand it better.
Attached Image (click to enlarge)